Unknown entries from news log file:
First 1 / 1 lines (100.0%)
Log entries by program:
| Program name | Lines | %Lines | Size | %Size |
|---|---|---|---|---|
| inn | 9963 | 53.3% | 1.4 MB | 54.8% |
| innd | 5432 | 29.1% | 673.5 KB | 26.6% |
| innfeed | 1991 | 10.6% | 277.6 KB | 10.9% |
| cnfsstat | 1152 | 6.2% | 179.3 KB | 7.1% |
| nnrpd | 109 | 0.6% | 10.9 KB | 0.4% |
| overchan | 26 | 0.1% | 3.9 KB | 0.2% |
| controlchan | 25 | 0.1% | 1.3 KB | 0.1% |
| TOTAL: 7 | 18698 | 100.0% | 2.5 MB | 100.0% |
History cache:
| Reason | Count | %Count |
|---|---|---|
| Positive hits | 17645 | 40.9% |
| Negative hits | 17088 | 39.7% |
| Do not exist | 8298 | 19.3% |
| Cache misses | 62 | 0.1% |
| TOTAL: 4 | 43093 | 100.0% |
INND timer:
| Code region | Time | Pct | Invoked | Min(ms) | Avg(ms) | Max(ms) |
|---|---|---|---|---|---|---|
| article cancel | 00:00:00.074 | 0.0% | 13 | 0.000 | 5.692 | 57.000 |
| article cleanup | 00:00:00.062 | 0.0% | 8448 | 0.000 | 0.007 | 0.048 |
| article logging | 00:00:00.718 | 0.0% | 8521 | 0.000 | 0.084 | 2.597 |
| article parse | 00:00:00.125 | 0.0% | 14194 | 0.000 | 0.009 | 0.036 |
| article write | 00:00:09.830 | 0.0% | 6649 | 0.000 | 1.478 | 63.217 |
| artlog/artcncl | 00:00:00.000 | 0.0% | 13 | 0.000 | 0.000 | 0.000 |
| data move | 00:00:00.029 | 0.0% | 42051 | 0.000 | 0.001 | 0.009 |
| hisgrep/artcncl | 00:00:00.001 | 0.0% | 13 | 0.000 | 0.077 | 0.200 |
| hishave/artcncl | 00:00:00.004 | 0.0% | 13 | 0.000 | 0.308 | 0.800 |
| history grep | 00:00:00.000 | 0.0% | 0 | 0.000 | 0.000 | 0.000 |
| history lookup | 00:00:09.664 | 0.0% | 43630 | 0.000 | 0.221 | 2.918 |
| history sync | 00:00:00.158 | 0.0% | 278 | 0.000 | 0.568 | 49.333 |
| history write | 00:00:02.151 | 0.0% | 8447 | 0.000 | 0.255 | 13.423 |
| idle | 20:00:01.528 | 99.9% | 46530 | 722.423 | 1547.422 | 6069.263 |
| nntp read | 00:00:00.308 | 0.0% | 45695 | 0.000 | 0.007 | 0.019 |
| overview write | 00:00:00.035 | 0.0% | 6649 | 0.000 | 0.005 | 0.051 |
| perl filter | 00:00:08.812 | 0.0% | 8447 | 0.528 | 1.043 | 5.431 |
| python filter | 00:00:00.194 | 0.0% | 8447 | 0.000 | 0.023 | 0.133 |
| site send | 00:00:01.092 | 0.0% | 19947 | 0.009 | 0.055 | 0.116 |
| TOTAL: 20:00:49.106 | 20:00:34.785 | 100.0% | - | - | - | - |
INNfeed timer:
| Code region | Time | Pct | Invoked | Min(ms) | Avg(ms) | Max(ms) |
|---|---|---|---|---|---|---|
| article new | 00:00:00.019 | 0.0% | 6634 | 0.000 | 0.003 | 0.077 |
| article prepare | 00:00:00.000 | 0.0% | 2673 | 0.000 | 0.000 | 0.000 |
| article read | 00:00:00.213 | 0.0% | 1501 | 0.000 | 0.142 | 25.500 |
| backlog stats | 00:00:00.033 | 0.0% | 42636 | 0.000 | 0.001 | 0.006 |
| callbacks | 00:00:00.000 | 0.0% | 0 | 0.000 | 0.000 | 0.000 |
| data read | 00:00:00.207 | 0.0% | 24644 | 0.000 | 0.008 | 0.031 |
| data write | 00:00:00.468 | 0.0% | 18228 | 0.000 | 0.026 | 0.106 |
| idle | 19:52:09.286 | 99.9% | 42636 | 809.898 | 1677.673 | 5087.254 |
| status file | 00:00:10.077 | 0.0% | 342 | 0.000 | 29.465 | 538.889 |
| TOTAL: 19:53:13.413 | 19:52:20.303 | 99.9% | - | - | - | - |
nnrpd timer:
| Code region | Time | Pct | Invoked | Min(ms) | Avg(ms) | Max(ms) |
|---|---|---|---|---|---|---|
| idle | 00:00:00.000 | 0.0% | 0 | 0.000 | 0.000 | 0.000 |
| newnews | 00:00:00.000 | 0.0% | 0 | 0.000 | 0.000 | 0.000 |
| nntpwrite | 00:00:00.000 | 0.0% | 23 | 0.000 | 0.000 | 0.000 |
| TOTAL: 00:00:02.792 | 00:00:00.000 | 0.0% | - | - | - | - |
Control commands to INND:
| Command | Number |
|---|---|
| flush | 5 |
| flushlogs | 2 |
| go | 2 |
| logmode | 2 |
| lowmark | 1 |
| mode | 170 |
| name | 2 |
| pause | 2 |
| paused | 2 |
| reserve | 2 |
| shutdown | 72 |
| TOTAL: 11 | 262 |
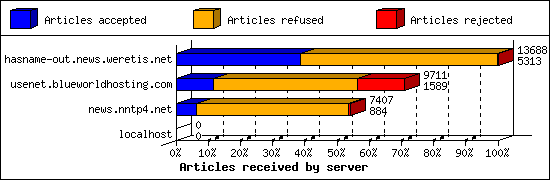
Incoming Feeds (INN):
| Server | Connects | Offered | Taken | Refused | Reject | %Accpt | Elapsed | |
|---|---|---|---|---|---|---|---|---|
| 1 | hasname-out.news.weretis.net | 51 | 13688 | 5313 | 8365 | 10 | 38% | 47:44:33 |
| 2 | usenet.blueworldhosting.com | 734 | 9711 | 1589 | 6142 | 1980 | 16% | 23:37:01 |
| 3 | news.nntp4.net | 25 | 7407 | 884 | 6431 | 92 | 11% | 23:47:49 |
| 4 | localhost | 1 | 0 | 0 | 0 | 0 | 0% | 00:00:00 |
| TOTAL: 4 | 811 | 30806 | 7786 | 20938 | 2082 | 25% | 95:09:23 | |
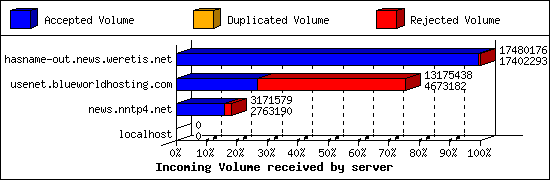
Incoming Volume (INN):
| Server | AcceptVol | DupVol | RejVol | TotalVol | %Acc | Vol/Art | |
|---|---|---|---|---|---|---|---|
| 1 | hasname-out.news.weretis.net | 16.6 MB | 3.0 KB | 73.0 KB | 16.7 MB | 99% | 3.2 KB |
| 2 | usenet.blueworldhosting.com | 4.5 MB | 0.0 KB | 8.1 MB | 12.6 MB | 35% | 3.6 KB |
| 3 | news.nntp4.net | 2.6 MB | 0.0 KB | 398.8 KB | 3.0 MB | 87% | 3.2 KB |
| 4 | localhost | 0.0 KB | 0.0 KB | 0.0 KB | 0.0 KB | 0% | 0 |
| TOTAL: 4 | 23.7 MB | 3.0 KB | 8.6 MB | 32.3 MB | 73% | 3.3 KB | |
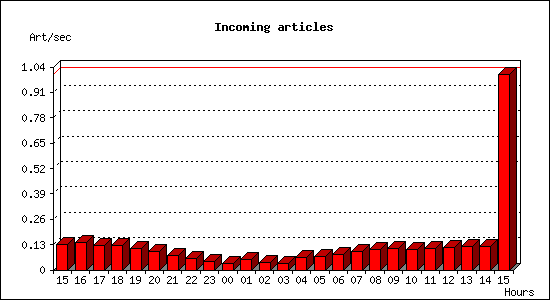
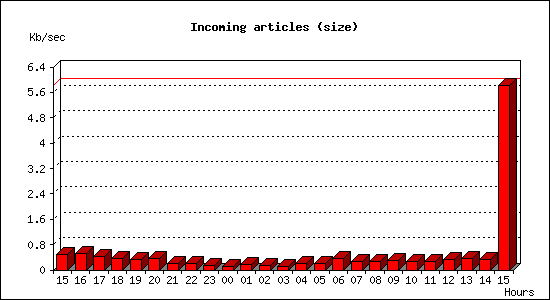
Incoming articles:
| Date | Articles | %Arts | Art/sec | Size | %Size | KB/sec |
|---|---|---|---|---|---|---|
| Jul 28 15:00:01 - 15:59:59 | 475 | 6.1% | 0.13 | 1.7 MB | 7.1% | 0.48 |
| Jul 28 16:00:00 - 16:59:59 | 500 | 6.4% | 0.14 | 1.8 MB | 7.7% | 0.52 |
| Jul 28 17:00:00 - 17:59:59 | 459 | 5.9% | 0.13 | 1.4 MB | 6.1% | 0.41 |
| Jul 28 18:00:00 - 18:59:59 | 452 | 5.8% | 0.13 | 1.3 MB | 5.4% | 0.37 |
| Jul 28 19:00:00 - 19:59:59 | 399 | 5.1% | 0.11 | 1.2 MB | 5.0% | 0.34 |
| Jul 28 20:00:00 - 20:59:59 | 343 | 4.4% | 0.10 | 1.2 MB | 5.2% | 0.35 |
| Jul 28 21:00:00 - 21:59:59 | 260 | 3.3% | 0.07 | 783.6 KB | 3.2% | 0.22 |
| Jul 28 22:00:00 - 22:59:59 | 207 | 2.7% | 0.06 | 715.0 KB | 2.9% | 0.20 |
| Jul 28 23:00:00 - 23:59:59 | 163 | 2.1% | 0.05 | 502.4 KB | 2.1% | 0.14 |
| Jul 29 00:00:00 - 00:59:59 | 122 | 1.6% | 0.03 | 427.5 KB | 1.8% | 0.12 |
| Jul 29 01:00:00 - 01:59:59 | 198 | 2.5% | 0.06 | 608.4 KB | 2.5% | 0.17 |
| Jul 29 02:00:00 - 02:59:59 | 141 | 1.8% | 0.04 | 468.0 KB | 1.9% | 0.13 |
| Jul 29 03:00:00 - 03:59:59 | 114 | 1.5% | 0.03 | 433.3 KB | 1.8% | 0.12 |
| Jul 29 04:00:00 - 04:59:59 | 231 | 3.0% | 0.06 | 767.8 KB | 3.2% | 0.21 |
| Jul 29 05:00:00 - 05:59:59 | 256 | 3.3% | 0.07 | 767.5 KB | 3.2% | 0.21 |
| Jul 29 06:00:00 - 06:59:59 | 294 | 3.8% | 0.08 | 1.3 MB | 5.5% | 0.37 |
| Jul 29 07:00:00 - 07:59:59 | 336 | 4.3% | 0.09 | 927.0 KB | 3.8% | 0.26 |
| Jul 29 08:00:00 - 08:59:59 | 385 | 5.0% | 0.11 | 923.2 KB | 3.8% | 0.26 |
| Jul 29 09:00:00 - 09:59:59 | 399 | 5.1% | 0.11 | 1.1 MB | 4.5% | 0.30 |
| Jul 29 10:00:00 - 10:59:59 | 373 | 4.8% | 0.10 | 994.9 KB | 4.1% | 0.28 |
| Jul 29 11:00:00 - 11:59:59 | 389 | 5.0% | 0.11 | 954.1 KB | 3.9% | 0.27 |
| Jul 29 12:00:00 - 12:59:59 | 415 | 5.3% | 0.12 | 1.2 MB | 4.9% | 0.33 |
| Jul 29 13:00:00 - 13:59:59 | 429 | 5.5% | 0.12 | 1.3 MB | 5.4% | 0.37 |
| Jul 29 14:00:00 - 14:59:59 | 425 | 5.5% | 0.12 | 1.2 MB | 5.1% | 0.34 |
| Jul 29 15:00:00 - 15:00:03 | 3 | 0.0% | 1.00 | 17.5 KB | 0.1% | 5.82 |
| TOTAL: 24:00:02 | 7768 | 100.0% | 0.09 | 23.7 MB | 100.0% | 0.28 |
CNFS buffer status:
| Buffer | Class | Size | Used | %Used | Cycles | KB/sec | Days |
|---|---|---|---|---|---|---|---|
| EIGHT | BIG | 4.0 GB | 2.9 GB | 72.6% | 1 | 0.00 | 0.00 |
| FIVE | BIG | 4.0 GB | 2.9 GB | 72.6% | 1 | 0.00 | 0.00 |
| FOUR | DEFAULT | 1024.0 MB | 452.2 MB | 44.2% | 29 | 0.12 | 99.25 |
| ONE | DEFAULT | 1024.0 MB | 661.5 MB | 64.6% | 31 | 0.12 | 101.17 |
| SEVEN | BIG | 4.0 GB | 2.9 GB | 72.6% | 1 | 0.00 | 0.00 |
| SIX | BIG | 4.0 GB | 2.9 GB | 72.8% | 1 | 0.00 | 0.00 |
| THREE | DEFAULT | 1024.0 MB | 471.9 MB | 46.1% | 29 | 0.12 | 101.79 |
| TWO | DEFAULT | 1024.0 MB | 472.2 MB | 46.1% | 29 | 0.13 | 97.03 |
| TOTAL: 8 | - | 20.0 GB | 13.6 GB | 68.2% | 122 | 0.12 | - |
Sites sending bad articles:
| Server | Total | Group | Dist | Duplic | Unapp | TooOld | Site | Line | Other | |
|---|---|---|---|---|---|---|---|---|---|---|
| 1 | usenet.blueworldhosting.com | 1997 | 1886 | 0 | 0 | 2 | 0 | 0 | 0 | 109 |
| 2 | news.nntp4.net | 119 | 0 | 0 | 0 | 0 | 0 | 0 | 0 | 119 |
| 3 | hasname-out.news.weretis.net | 67 | 1 | 0 | 1 | 0 | 0 | 0 | 0 | 65 |
| TOTAL: 3 | 2183 | 1887 | 0 | 1 | 2 | 0 | 0 | 0 | 293 | |
Unwanted newsgroups [Top 20]:
| Newsgroup | Count |
|---|---|
| panix.questions | 329 |
| org.kernel.vger.linux-kernel | 324 |
| panix.chat | 249 |
| linux.kernel.netdev | 193 |
| org.nongnu.qemu-devel | 79 |
| panix.user.macintosh | 70 |
| org.xenproject.lists.xen-devel | 52 |
| panix.flame | 48 |
| org.infradead.lists.linux-riscv | 43 |
| fido7.pushkin.local | 40 |
| fido7.ukrnews | 35 |
| org.kernel.vger.kvm | 34 |
| org.kernel.vger.linux-doc | 32 |
| org.kvack.linux-mm | 32 |
| org.kernel.vger.linux-nfs | 25 |
| fido7.fidonet.online | 23 |
| linux.kernel.git | 18 |
| org.kernel.vger.linux-cxl | 17 |
| org.kernel.vger.linux-btrfs | 17 |
| panix.user.movies | 16 |
| TOTAL: 67 | 1887 |
Supposedly-moderated groups with unmoderated postings [Top 20]:
| Groups | Count |
|---|---|
| uk.religion.christian | 2 |
| TOTAL: 1 | 2 |
INND Perl filter [Top 20]:
| Reason | Count |
|---|---|
| Too many newsgroups | 110 |
| EMP (md5) | 82 |
| HTML Multipart | 8 |
| EMP (phl) | 1 |
| TOTAL: 4 | 201 |
INND no permission servers:
| System | Conn |
|---|---|
| 162.142.125.41 | 1 |
| 194.165.16.76 | 1 |
| 194.165.16.72 | 1 |
| TOTAL: 3 | 3 |
Miscellaneous innd statistics [Top 10]:
| Event | Server | Number |
|---|---|---|
| Including strange strings | ||
| hasname-out.news.weretis.net | 57 | |
| usenet.blueworldhosting.com | 34 | |
| news.nntp4.net | 1 | |
| TOTAL: 3 | 92 | |
| TOTAL: 1 | 92 | |
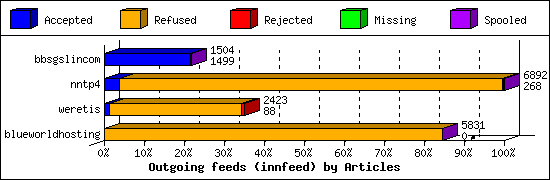
Outgoing Feeds (innfeed) by Articles:
| Server | Offered | Taken | Refused | Reject | Miss | Spool | %Took | Elapsed | |
|---|---|---|---|---|---|---|---|---|---|
| 1 | bbsgslincom | 1500 | 1499 | 0 | 1 | 0 | 4 | 99% | 23:49:44 |
| 2 | nntp4 | 8664 | 268 | 6604 | 9 | 0 | 11 | 3% | 23:56:37 |
| 3 | weretis | 2582 | 88 | 2286 | 49 | 0 | 0 | 3% | 23:56:44 |
| 4 | blueworldhosting | 6819 | 0 | 5828 | 0 | 0 | 3 | 0% | 23:56:44 |
| 5 | aioe | 0 | 0 | 0 | 0 | 0 | 7726 | 0% | 23:57:56 |
| TOTAL: 5 | 19565 | 1855 | 14718 | 59 | 0 | 7744 | 9% | 119:37:45 | |
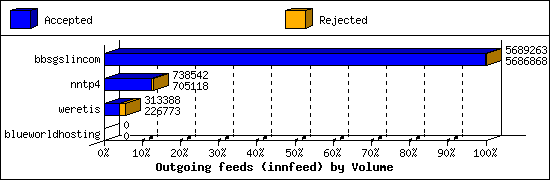
Outgoing Feeds (innfeed) by Volume:
| Server | AcceptVol | RejectVol | TotalVol | Volume/sec | Vol/Art | Elapsed | |
|---|---|---|---|---|---|---|---|
| 1 | bbsgslincom | 5.4 MB | 2.3 KB | 5.4 MB | 0.1 KB/s | 3.7 KB | 23:49:44 |
| 2 | nntp4 | 688.6 KB | 32.6 KB | 721.2 KB | 0.0 KB/s | 2.6 KB | 23:56:37 |
| 3 | weretis | 221.5 KB | 84.6 KB | 306.0 KB | 0.0 KB/s | 2.2 KB | 23:56:44 |
| 4 | blueworldhosting | 0.0 KB | 0.0 KB | 0.0 KB | 0.0 KB/s | 0 | 23:56:44 |
| 5 | aioe | 0.0 KB | 0.0 KB | 0.0 KB | 0.0 KB/s | 0 | 23:57:56 |
| TOTAL: 5 | 6.3 MB | 119.6 KB | 6.4 MB | 0.0 KB/s | 3.4 KB | 119:37:45 | |
NNRP total resource statistics [Top 20]:
| System | User(ms) | System(ms) | Idle(ms) | Elapsed |
|---|---|---|---|---|
| 164.92.114.247 | 0.002 | 0.006 | 0.000 | 00:00:02 |
| 172-232-220-71.ip.linodeusercontent.com | 0.002 | 0.000 | 0.000 | 00:00:00 |
| 147.182.241.81 | 0.001 | 0.003 | 0.000 | 00:00:00 |
| 164.92.106.15 | 0.000 | 0.004 | 0.000 | 00:00:00 |
| azpdwsb6.stretchoid.com | 0.001 | 0.001 | 0.000 | 00:00:00 |
| 167.94.138.36 | 0.000 | 0.002 | 0.000 | 00:00:00 |
| azpdcg66.stretchoid.com | 0.000 | 0.002 | 0.000 | 00:00:00 |
| 167.94.145.110 | 0.004 | 0.002 | 0.000 | 00:00:00 |
| 167.94.146.54 | 0.003 | 0.002 | 0.000 | 00:00:00 |
| 198.235.24.28 | 0.000 | 0.002 | 0.000 | 00:00:00 |
| glamorous.monitoring.internet-measurement.com | 0.001 | 0.001 | 0.000 | 00:00:00 |
| 198.235.24.181 | 0.000 | 0.002 | 0.000 | 00:00:00 |
| ? | 0.000 | 0.001 | 0.000 | 00:00:00 |
| 37.120.156.202 | 0.000 | 0.002 | 0.000 | 00:00:00 |
| TOTAL: 14 | 0.014 | 0.030 | 0.000 | 00:00:02 |
NNRP no permission clients:
| System | Conn |
|---|---|
| 164.92.114.247 | 4 |
| 167.94.145.110 | 3 |
| 167.94.146.54 | 3 |
| 164.92.106.15 | 2 |
| 147.182.241.81 | 2 |
| 37.120.156.202 | 1 |
| azpdwsb6.stretchoid.com | 1 |
| 198.235.24.28 | 1 |
| 172-232-220-71.ip.linodeusercontent.com | 1 |
| 167.94.138.36 | 1 |
| glamorous.monitoring.internet-measurement.com | 1 |
| 198.235.24.181 | 1 |
| azpdcg66.stretchoid.com | 1 |
| TOTAL: 13 | 22 |
NNRP gethostbyaddr failures [Top 20]:
| System | Conn |
|---|---|
| ? (can't getpeername) | 1 |
| TOTAL: 1 | 1 |