Unknown entries from news log file:
First 3 / 3 lines (100.0%)
Log entries by program:
| Program name | Lines | %Lines | Size | %Size |
|---|---|---|---|---|
| inn | 9236 | 51.2% | 1.3 MB | 52.6% |
| innd | 5541 | 30.7% | 685.9 KB | 28.0% |
| innfeed | 1968 | 10.9% | 275.1 KB | 11.2% |
| cnfsstat | 1152 | 6.4% | 179.1 KB | 7.3% |
| nnrpd | 59 | 0.3% | 5.8 KB | 0.2% |
| controlchan | 57 | 0.3% | 9.1 KB | 0.4% |
| overchan | 25 | 0.1% | 4.2 KB | 0.2% |
| pgpverify | 2 | 0.0% | 0.2 KB | 0.0% |
| TOTAL: 8 | 18040 | 100.0% | 2.4 MB | 100.0% |
History cache:
| Reason | Count | %Count |
|---|---|---|
| Positive hits | 18055 | 43.6% |
| Negative hits | 15783 | 38.1% |
| Do not exist | 7398 | 17.9% |
| Cache misses | 197 | 0.5% |
| TOTAL: 4 | 41433 | 100.0% |
INND timer:
| Code region | Time | Pct | Invoked | Min(ms) | Avg(ms) | Max(ms) |
|---|---|---|---|---|---|---|
| article cancel | 00:00:02.506 | 0.0% | 132 | 0.000 | 18.985 | 551.000 |
| article cleanup | 00:00:00.051 | 0.0% | 7499 | 0.000 | 0.007 | 0.067 |
| article logging | 00:00:00.230 | 0.0% | 7578 | 0.000 | 0.030 | 0.118 |
| article parse | 00:00:00.139 | 0.0% | 12648 | 0.000 | 0.011 | 0.100 |
| article write | 00:00:08.340 | 0.0% | 6954 | 0.000 | 1.199 | 55.500 |
| artlog/artcncl | 00:00:00.000 | 0.0% | 131 | 0.000 | 0.000 | 0.000 |
| artlog/artparse | 00:00:00.000 | 0.0% | 1 | 0.000 | 0.000 | 0.000 |
| data move | 00:00:00.033 | 0.0% | 41067 | 0.000 | 0.001 | 0.010 |
| hisgrep/artcncl | 00:00:00.002 | 0.0% | 129 | 0.000 | 0.016 | 1.000 |
| hishave/artcncl | 00:00:00.295 | 0.0% | 132 | 0.000 | 2.235 | 27.000 |
| history grep | 00:00:00.000 | 0.0% | 0 | 0.000 | 0.000 | 0.000 |
| history lookup | 00:00:00.500 | 0.0% | 41952 | 0.000 | 0.012 | 0.348 |
| history sync | 00:00:00.005 | 0.0% | 297 | 0.000 | 0.017 | 0.500 |
| history write | 00:00:02.167 | 0.0% | 7500 | 0.000 | 0.289 | 13.310 |
| hiswrite/artcncl | 00:00:00.000 | 0.0% | 3 | 0.000 | 0.000 | 0.000 |
| idle | 20:00:18.844 | 100.0% | 45890 | 811.489 | 1569.380 | 7059.953 |
| nntp read | 00:00:00.284 | 0.0% | 44993 | 0.000 | 0.006 | 0.030 |
| overview write | 00:00:00.025 | 0.0% | 6954 | 0.000 | 0.004 | 0.033 |
| perl filter | 00:00:07.375 | 0.0% | 7499 | 0.658 | 0.983 | 1.594 |
| python filter | 00:00:00.159 | 0.0% | 7499 | 0.000 | 0.021 | 0.125 |
| site send | 00:00:01.164 | 0.0% | 20865 | 0.000 | 0.056 | 0.117 |
| TOTAL: 20:00:50.037 | 20:00:42.119 | 100.0% | - | - | - | - |
INNfeed timer:
| Code region | Time | Pct | Invoked | Min(ms) | Avg(ms) | Max(ms) |
|---|---|---|---|---|---|---|
| article new | 00:00:00.016 | 0.0% | 6921 | 0.000 | 0.002 | 0.024 |
| article prepare | 00:00:00.001 | 0.0% | 2569 | 0.000 | 0.000 | 0.032 |
| article read | 00:00:00.054 | 0.0% | 1514 | 0.000 | 0.036 | 0.500 |
| backlog stats | 00:00:00.025 | 0.0% | 46528 | 0.000 | 0.001 | 0.007 |
| callbacks | 00:00:00.000 | 0.0% | 0 | 0.000 | 0.000 | 0.000 |
| data read | 00:00:00.212 | 0.0% | 26484 | 0.000 | 0.008 | 0.036 |
| data write | 00:00:00.470 | 0.0% | 19739 | 0.000 | 0.024 | 0.092 |
| idle | 19:53:51.910 | 99.9% | 46528 | 960.816 | 1539.544 | 5614.224 |
| status file | 00:00:05.964 | 0.0% | 331 | 0.000 | 18.018 | 1263.000 |
| TOTAL: 19:54:49.940 | 19:53:58.652 | 99.9% | - | - | - | - |
nnrpd timer:
| Code region | Time | Pct | Invoked | Min(ms) | Avg(ms) | Max(ms) |
|---|---|---|---|---|---|---|
| idle | 00:00:00.000 | 0.0% | 0 | 0.000 | 0.000 | 0.000 |
| newnews | 00:00:00.000 | 0.0% | 0 | 0.000 | 0.000 | 0.000 |
| nntpwrite | 00:00:00.000 | 0.0% | 12 | 0.000 | 0.000 | 0.000 |
| TOTAL: 00:00:00.705 | 00:00:00.000 | 0.0% | - | - | - | - |
Control commands to INND:
| Command | Number |
|---|---|
| flush | 5 |
| flushlogs | 2 |
| go | 2 |
| logmode | 2 |
| lowmark | 1 |
| mode | 170 |
| name | 2 |
| pause | 2 |
| paused | 2 |
| reserve | 2 |
| shutdown | 72 |
| TOTAL: 11 | 262 |
Control Channel:
| Sender | newgroup | rmgroup | Other | Bad PGP | DoIt | OK |
|---|---|---|---|---|---|---|
| bofh-control@killfile.org | 0 | 0 | 1 | 0 | 0 | 1 |
| moderator@dana.de | 0 | 0 | 1 | 1 | 0 | 1 |
| us-control@lists.killfile.org | 0 | 0 | 0 | 1 | 0 | 0 |
| TOTAL | 0 | 0 | 2 | 2 | 0 | 2 |
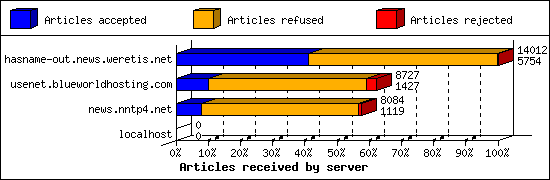
Incoming Feeds (INN):
| Server | Connects | Offered | Taken | Refused | Reject | %Accpt | Elapsed | |
|---|---|---|---|---|---|---|---|---|
| 1 | hasname-out.news.weretis.net | 55 | 14012 | 5754 | 8233 | 25 | 41% | 47:53:58 |
| 2 | usenet.blueworldhosting.com | 733 | 8727 | 1427 | 6861 | 439 | 16% | 23:35:33 |
| 3 | news.nntp4.net | 25 | 8084 | 1119 | 6826 | 139 | 13% | 23:47:50 |
| 4 | localhost | 1 | 0 | 0 | 0 | 0 | 0% | 00:00:00 |
| TOTAL: 4 | 814 | 30823 | 8300 | 21920 | 603 | 26% | 95:17:21 | |
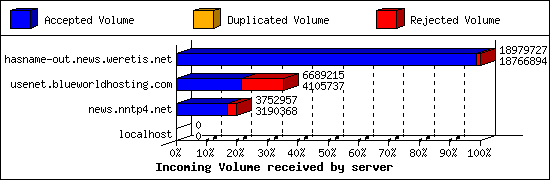
Incoming Volume (INN):
| Server | AcceptVol | DupVol | RejVol | TotalVol | %Acc | Vol/Art | |
|---|---|---|---|---|---|---|---|
| 1 | hasname-out.news.weretis.net | 17.9 MB | 0.0 KB | 207.8 KB | 18.1 MB | 98% | 3.2 KB |
| 2 | usenet.blueworldhosting.com | 3.9 MB | 0.0 KB | 2.5 MB | 6.4 MB | 61% | 3.5 KB |
| 3 | news.nntp4.net | 3.0 MB | 0.0 KB | 549.4 KB | 3.6 MB | 85% | 2.9 KB |
| 4 | localhost | 0.0 KB | 0.0 KB | 0.0 KB | 0.0 KB | 0% | 0 |
| TOTAL: 4 | 24.9 MB | 0.0 KB | 3.2 MB | 28.1 MB | 88% | 3.2 KB | |
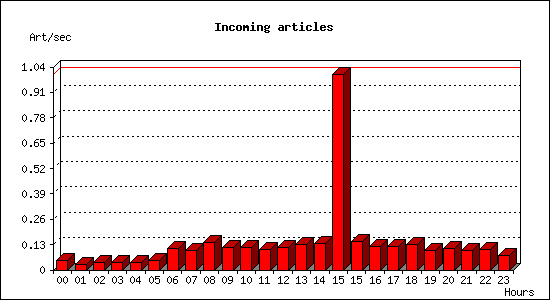
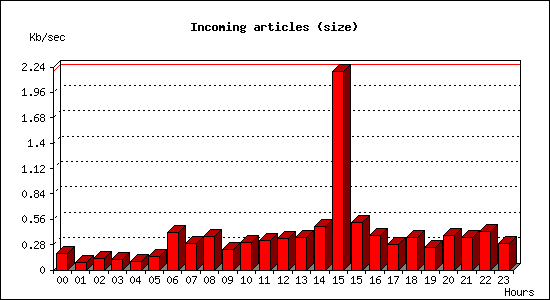
Incoming articles:
| Date | Articles | %Arts | Art/sec | Size | %Size | KB/sec |
|---|---|---|---|---|---|---|
| May 31 15:00:01 - 15:59:59 | 517 | 6.2% | 0.14 | 1.8 MB | 7.3% | 0.52 |
| May 31 16:00:00 - 16:59:59 | 436 | 5.2% | 0.12 | 1.3 MB | 5.3% | 0.38 |
| May 31 17:00:00 - 17:59:59 | 436 | 5.2% | 0.12 | 1.0 MB | 4.0% | 0.29 |
| May 31 18:00:00 - 18:59:59 | 466 | 5.6% | 0.13 | 1.2 MB | 5.0% | 0.35 |
| May 31 19:00:00 - 19:59:59 | 366 | 4.4% | 0.10 | 912.2 KB | 3.6% | 0.25 |
| May 31 20:00:00 - 20:59:59 | 403 | 4.8% | 0.11 | 1.3 MB | 5.3% | 0.38 |
| May 31 21:00:00 - 21:59:59 | 353 | 4.2% | 0.10 | 1.3 MB | 5.0% | 0.36 |
| May 31 22:00:00 - 22:59:59 | 370 | 4.4% | 0.10 | 1.5 MB | 6.0% | 0.43 |
| May 31 23:00:00 - 23:59:59 | 270 | 3.2% | 0.07 | 1.0 MB | 4.0% | 0.29 |
| Jun 1 00:00:00 - 00:59:59 | 172 | 2.1% | 0.05 | 652.5 KB | 2.5% | 0.18 |
| Jun 1 01:00:00 - 01:59:59 | 105 | 1.3% | 0.03 | 309.3 KB | 1.2% | 0.09 |
| Jun 1 02:00:00 - 02:59:59 | 143 | 1.7% | 0.04 | 466.9 KB | 1.8% | 0.13 |
| Jun 1 03:00:00 - 03:59:59 | 135 | 1.6% | 0.04 | 412.0 KB | 1.6% | 0.11 |
| Jun 1 04:00:00 - 04:59:59 | 132 | 1.6% | 0.04 | 344.4 KB | 1.3% | 0.10 |
| Jun 1 05:00:00 - 05:59:59 | 181 | 2.2% | 0.05 | 551.3 KB | 2.1% | 0.15 |
| Jun 1 06:00:00 - 06:59:59 | 393 | 4.7% | 0.11 | 1.4 MB | 5.8% | 0.41 |
| Jun 1 07:00:00 - 07:59:59 | 365 | 4.4% | 0.10 | 1.0 MB | 4.1% | 0.29 |
| Jun 1 08:00:00 - 08:59:59 | 502 | 6.0% | 0.14 | 1.3 MB | 5.2% | 0.37 |
| Jun 1 09:00:00 - 09:59:59 | 414 | 5.0% | 0.12 | 829.2 KB | 3.2% | 0.23 |
| Jun 1 10:00:00 - 10:59:59 | 422 | 5.1% | 0.12 | 1.1 MB | 4.3% | 0.31 |
| Jun 1 11:00:00 - 11:59:59 | 370 | 4.4% | 0.10 | 1.2 MB | 4.6% | 0.33 |
| Jun 1 12:00:00 - 12:59:59 | 424 | 5.1% | 0.12 | 1.2 MB | 4.8% | 0.35 |
| Jun 1 13:00:00 - 13:59:59 | 462 | 5.5% | 0.13 | 1.3 MB | 5.0% | 0.36 |
| Jun 1 14:00:00 - 14:59:59 | 489 | 5.9% | 0.14 | 1.7 MB | 6.7% | 0.48 |
| Jun 1 15:00:00 - 15:00:01 | 1 | 0.0% | 1.00 | 2.2 KB | 0.0% | 2.19 |
| TOTAL: 24:00:00 | 8327 | 100.0% | 0.10 | 25.1 MB | 100.0% | 0.30 |
CNFS buffer status:
| Buffer | Class | Size | Used | %Used | Cycles | KB/sec | Days |
|---|---|---|---|---|---|---|---|
| EIGHT | BIG | 4.0 GB | 2.9 GB | 72.6% | 1 | 0.00 | 0.00 |
| FIVE | BIG | 4.0 GB | 2.9 GB | 72.6% | 1 | 0.00 | 0.00 |
| FOUR | DEFAULT | 1024.0 MB | 884.6 MB | 86.4% | 28 | 0.13 | 92.33 |
| ONE | DEFAULT | 1024.0 MB | 64.8 MB | 6.3% | 31 | 0.13 | 94.68 |
| SEVEN | BIG | 4.0 GB | 2.9 GB | 72.6% | 1 | 0.00 | 0.00 |
| SIX | BIG | 4.0 GB | 2.9 GB | 72.8% | 1 | 0.00 | 0.00 |
| THREE | DEFAULT | 1024.0 MB | 902.9 MB | 88.2% | 28 | 0.13 | 93.80 |
| TWO | DEFAULT | 1024.0 MB | 898.6 MB | 87.8% | 28 | 0.13 | 95.04 |
| TOTAL: 8 | - | 20.0 GB | 14.3 GB | 71.5% | 119 | 0.13 | - |
Sites sending bad articles:
| Server | Total | Group | Dist | Duplic | Unapp | TooOld | Site | Line | Other | |
|---|---|---|---|---|---|---|---|---|---|---|
| 1 | usenet.blueworldhosting.com | 452 | 369 | 0 | 0 | 1 | 0 | 0 | 0 | 82 |
| 2 | news.nntp4.net | 140 | 0 | 0 | 0 | 0 | 0 | 0 | 0 | 140 |
| 3 | hasname-out.news.weretis.net | 100 | 1 | 0 | 0 | 0 | 0 | 0 | 0 | 99 |
| TOTAL: 3 | 692 | 370 | 0 | 0 | 1 | 0 | 0 | 0 | 321 | |
Unwanted newsgroups [Top 20]:
| Newsgroup | Count |
|---|---|
| linux.kernel.netdev | 114 |
| fido7.fidonet.telegram | 67 |
| fido7.pushkin.local | 34 |
| linux.kernel.git | 23 |
| perl.cpan | 21 |
| fido7.ukrnews | 21 |
| fido7.lorapvt.horo | 12 |
| rocksolid.feeds.news | 12 |
| fido7.fidonet.online | 11 |
| kraft.talks | 11 |
| kraft.politics | 10 |
| fido7.f715.techinfo | 6 |
| fido7.starper.limited | 5 |
| fido7.lorapvt | 3 |
| fido7.crimea.business | 3 |
| kraft.vehicles | 3 |
| fido7.crimea.robots | 2 |
| kraft.building | 2 |
| kraft.competent | 1 |
| aol.neighborhood.ca.fresno.marketplace | 1 |
| TOTAL: 28 | 370 |
Supposedly-moderated groups with unmoderated postings [Top 20]:
| Groups | Count |
|---|---|
| zippo.general | 1 |
| TOTAL: 1 | 1 |
INND Perl filter [Top 20]:
| Reason | Count |
|---|---|
| EMP (md5) | 140 |
| EMP (fsl) | 65 |
| Too many newsgroups (meow) | 20 |
| HTML Multipart | 3 |
| Scoring filter | 1 |
| TOTAL: 5 | 229 |
INND no permission servers:
| System | Conn |
|---|---|
| 167.94.138.45 | 1 |
| 80.66.76.134 | 1 |
| TOTAL: 2 | 2 |
Miscellaneous innd statistics [Top 10]:
| Event | Server | Number |
|---|---|---|
| Bad Message-ID's offered | ||
| usenet.blueworldhosting.com | 1 | |
| TOTAL: 1 | 1 | |
| Including strange strings | ||
| hasname-out.news.weretis.net | 76 | |
| usenet.blueworldhosting.com | 14 | |
| news.nntp4.net | 1 | |
| TOTAL: 3 | 91 | |
| TOTAL: 2 | 92 | |
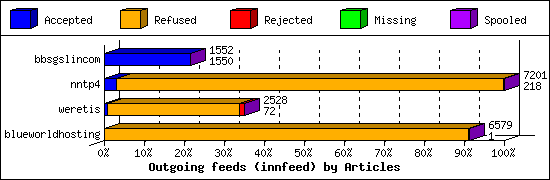
Outgoing Feeds (innfeed) by Articles:
| Server | Offered | Taken | Refused | Reject | Miss | Spool | %Took | Elapsed | |
|---|---|---|---|---|---|---|---|---|---|
| 1 | bbsgslincom | 1552 | 1550 | 0 | 0 | 0 | 2 | 99% | 23:53:57 |
| 2 | nntp4 | 8849 | 218 | 6971 | 3 | 0 | 9 | 2% | 23:56:07 |
| 3 | weretis | 2632 | 72 | 2375 | 79 | 0 | 2 | 2% | 23:53:09 |
| 4 | blueworldhosting | 8881 | 1 | 6565 | 0 | 0 | 13 | 0% | 23:56:09 |
| 5 | aioe | 0 | 0 | 0 | 0 | 0 | 8304 | 0% | 23:57:44 |
| TOTAL: 5 | 21914 | 1841 | 15911 | 82 | 0 | 8330 | 8% | 119:37:06 | |
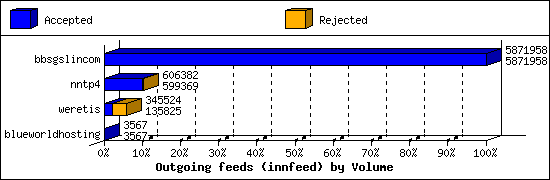
Outgoing Feeds (innfeed) by Volume:
| Server | AcceptVol | RejectVol | TotalVol | Volume/sec | Vol/Art | Elapsed | |
|---|---|---|---|---|---|---|---|
| 1 | bbsgslincom | 5.6 MB | 0.0 KB | 5.6 MB | 0.1 KB/s | 3.7 KB | 23:53:57 |
| 2 | nntp4 | 585.3 KB | 6.8 KB | 592.2 KB | 0.0 KB/s | 2.7 KB | 23:56:07 |
| 3 | weretis | 132.6 KB | 204.8 KB | 337.4 KB | 0.0 KB/s | 2.2 KB | 23:53:09 |
| 4 | blueworldhosting | 3.5 KB | 0.0 KB | 3.5 KB | 0.0 KB/s | 3.5 KB | 23:56:09 |
| 5 | aioe | 0.0 KB | 0.0 KB | 0.0 KB | 0.0 KB/s | 0 | 23:57:44 |
| TOTAL: 5 | 6.3 MB | 211.6 KB | 6.5 MB | 0.0 KB/s | 3.5 KB | 119:37:06 | |
NNRP total resource statistics [Top 20]:
| System | User(ms) | System(ms) | Idle(ms) | Elapsed |
|---|---|---|---|---|
| 123.245.85.44 | 0.000 | 0.002 | 0.000 | 00:00:00 |
| glamorous.monitoring.internet-measurement.com | 0.001 | 0.001 | 0.000 | 00:00:00 |
| 206.168.34.117 | 0.001 | 0.002 | 0.000 | 00:00:00 |
| 165.227.188.42 | 0.001 | 0.003 | 0.000 | 00:00:00 |
| 178.128.32.203 | 0.000 | 0.004 | 0.000 | 00:00:00 |
| 139.59.170.85 | 0.002 | 0.003 | 0.000 | 00:00:00 |
| 167.94.146.56 | 0.001 | 0.004 | 0.000 | 00:00:00 |
| TOTAL: 7 | 0.006 | 0.019 | 0.000 | 00:00:00 |
NNRP no permission clients:
| System | Conn |
|---|---|
| 167.94.146.56 | 3 |
| 139.59.170.85 | 2 |
| 165.227.188.42 | 2 |
| 178.128.32.203 | 2 |
| 123.245.85.44 | 1 |
| 206.168.34.117 | 1 |
| glamorous.monitoring.internet-measurement.com | 1 |
| TOTAL: 7 | 12 |