Unknown entries from news log file:
First 1 / 1 lines (100.0%)
Log entries by program:
| Program name | Lines | %Lines | Size | %Size |
|---|---|---|---|---|
| inn | 13764 | 60.2% | 1.8 MB | 60.1% |
| innd | 6512 | 28.5% | 876.2 KB | 27.9% |
| innfeed | 1412 | 6.2% | 201.0 KB | 6.4% |
| cnfsstat | 1152 | 5.0% | 173.7 KB | 5.5% |
| nnrpd | 29 | 0.1% | 2.9 KB | 0.1% |
| overchan | 1 | 0.0% | 0.2 KB | 0.0% |
| controlchan | 1 | 0.0% | 0.1 KB | 0.0% |
| TOTAL: 7 | 22871 | 100.0% | 3.1 MB | 100.0% |
History cache:
| Reason | Count | %Count |
|---|---|---|
| Positive hits | 32657 | 42.4% |
| Negative hits | 30846 | 40.1% |
| Do not exist | 13424 | 17.4% |
| Cache misses | 36 | 0.0% |
| TOTAL: 4 | 76963 | 100.0% |
INND timer:
| Code region | Time | Pct | Invoked | Min(ms) | Avg(ms) | Max(ms) |
|---|---|---|---|---|---|---|
| article cancel | 00:00:01.514 | 0.0% | 71 | 0.000 | 21.324 | 197.000 |
| article cleanup | 00:00:00.088 | 0.0% | 13458 | 0.000 | 0.007 | 0.075 |
| article logging | 00:00:00.334 | 0.0% | 13703 | 0.000 | 0.024 | 0.073 |
| article parse | 00:00:00.226 | 0.0% | 25427 | 0.000 | 0.009 | 0.031 |
| article write | 00:00:00.567 | 0.0% | 10784 | 0.000 | 0.053 | 0.216 |
| artlog/artcncl | 00:00:00.000 | 0.0% | 63 | 0.000 | 0.000 | 0.000 |
| artlog/artparse | 00:00:00.000 | 0.0% | 0 | 0.000 | 0.000 | 0.000 |
| data move | 00:00:00.052 | 0.0% | 83619 | 0.000 | 0.001 | 0.005 |
| hisgrep/artcncl | 00:00:00.000 | 0.0% | 71 | 0.000 | 0.000 | 0.000 |
| hishave/artcncl | 00:00:00.359 | 0.0% | 71 | 0.000 | 5.056 | 94.000 |
| history grep | 00:00:00.000 | 0.0% | 0 | 0.000 | 0.000 | 0.000 |
| history lookup | 00:00:09.808 | 0.0% | 77112 | 0.000 | 0.127 | 1.946 |
| history sync | 00:00:00.012 | 0.0% | 332 | 0.000 | 0.036 | 1.000 |
| history write | 00:00:00.993 | 0.0% | 13458 | 0.000 | 0.074 | 7.320 |
| hiswrite/artcncl | 00:00:00.000 | 0.0% | 0 | 0.000 | 0.000 | 0.000 |
| idle | 24:00:00.440 | 100.0% | 86253 | 546.842 | 1001.709 | 2532.506 |
| nntp read | 00:00:00.566 | 0.0% | 85385 | 0.000 | 0.007 | 0.017 |
| overview write | 00:00:00.029 | 0.0% | 10784 | 0.000 | 0.003 | 0.031 |
| perl filter | 00:00:15.472 | 0.0% | 13458 | 0.827 | 1.150 | 1.659 |
| python filter | 00:00:00.371 | 0.0% | 13458 | 0.000 | 0.028 | 0.068 |
| site send | 00:00:01.756 | 0.0% | 32352 | 0.000 | 0.054 | 0.105 |
| TOTAL: 24:00:40.549 | 24:00:32.587 | 100.0% | - | - | - | - |
INNfeed timer:
| Code region | Time | Pct | Invoked | Min(ms) | Avg(ms) | Max(ms) |
|---|---|---|---|---|---|---|
| article new | 00:00:00.030 | 0.0% | 10768 | 0.000 | 0.003 | 0.023 |
| article prepare | 00:00:00.002 | 0.0% | 8298 | 0.000 | 0.000 | 0.010 |
| article read | 00:00:00.072 | 0.0% | 2092 | 0.000 | 0.034 | 0.500 |
| backlog stats | 00:00:00.038 | 0.0% | 65606 | 0.000 | 0.001 | 0.009 |
| callbacks | 00:00:00.000 | 0.0% | 0 | 0.000 | 0.000 | 0.000 |
| data read | 00:00:00.264 | 0.0% | 38447 | 0.000 | 0.007 | 0.027 |
| data write | 00:00:00.771 | 0.0% | 27769 | 0.000 | 0.028 | 0.074 |
| idle | 23:58:05.007 | 100.0% | 65606 | 692.722 | 1315.200 | 3595.030 |
| status file | 00:00:00.065 | 0.0% | 256 | 0.000 | 0.254 | 1.000 |
| TOTAL: 23:58:08.070 | 23:58:06.249 | 100.0% | - | - | - | - |
nnrpd timer:
| Code region | Time | Pct | Invoked | Min(ms) | Avg(ms) | Max(ms) |
|---|---|---|---|---|---|---|
| idle | 00:00:00.000 | 0.0% | 0 | 0.000 | 0.000 | 0.000 |
| newnews | 00:00:00.000 | 0.0% | 0 | 0.000 | 0.000 | 0.000 |
| nntpwrite | 00:00:00.000 | 0.0% | 6 | 0.000 | 0.000 | 0.000 |
| TOTAL: 00:00:01.127 | 00:00:00.000 | 0.0% | - | - | - | - |
Control commands to INND:
| Command | Number |
|---|---|
| flush | 5 |
| flushlogs | 2 |
| go | 2 |
| logmode | 2 |
| lowmark | 1 |
| mode | 147 |
| name | 2 |
| pause | 2 |
| paused | 2 |
| reserve | 2 |
| TOTAL: 10 | 167 |
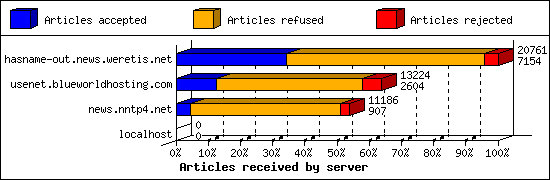
Incoming Feeds (INN):
| Server | Connects | Offered | Taken | Refused | Reject | %Accpt | Elapsed | |
|---|---|---|---|---|---|---|---|---|
| 1 | hasname-out.news.weretis.net | 3 | 20761 | 7154 | 12734 | 873 | 34% | 46:11:56 |
| 2 | usenet.blueworldhosting.com | 720 | 13224 | 2604 | 9422 | 1198 | 19% | 23:47:09 |
| 3 | news.nntp4.net | 1 | 11186 | 907 | 9703 | 576 | 8% | 24:08:04 |
| 4 | localhost | 1 | 0 | 0 | 0 | 0 | 0% | 00:00:00 |
| TOTAL: 4 | 725 | 45171 | 10665 | 31859 | 2647 | 23% | 94:07:09 | |
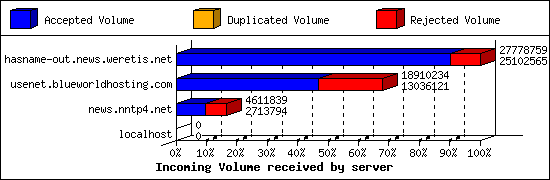
Incoming Volume (INN):
| Server | AcceptVol | DupVol | RejVol | TotalVol | %Acc | Vol/Art | |
|---|---|---|---|---|---|---|---|
| 1 | hasname-out.news.weretis.net | 23.9 MB | 0.0 KB | 2.6 MB | 26.5 MB | 90% | 3.4 KB |
| 2 | usenet.blueworldhosting.com | 12.4 MB | 0.0 KB | 5.6 MB | 18.0 MB | 68% | 4.9 KB |
| 3 | news.nntp4.net | 2.6 MB | 0.0 KB | 1.8 MB | 4.4 MB | 58% | 3.0 KB |
| 4 | localhost | 0.0 KB | 0.0 KB | 0.0 KB | 0.0 KB | 0% | 0 |
| TOTAL: 4 | 39.0 MB | 0.0 KB | 10.0 MB | 48.9 MB | 79% | 3.8 KB | |
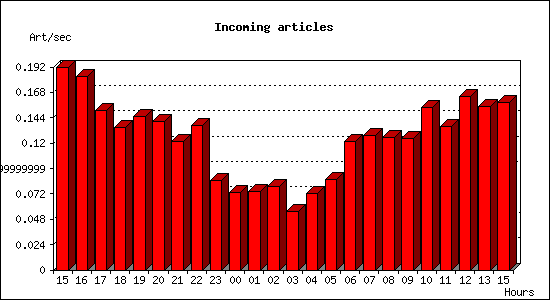
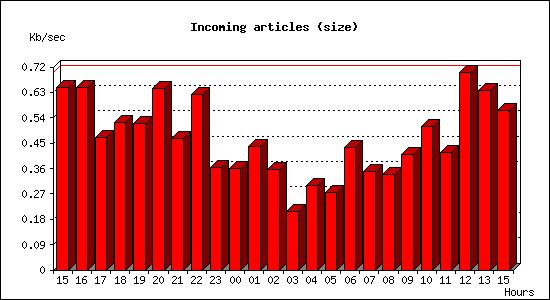
Incoming articles:
| Date | Articles | %Arts | Art/sec | Size | %Size | KB/sec |
|---|---|---|---|---|---|---|
| Aug 8 15:00:01 - 15:59:59 | 691 | 6.4% | 0.19 | 2.3 MB | 5.8% | 0.65 |
| Aug 8 16:00:00 - 16:59:59 | 660 | 6.1% | 0.18 | 2.3 MB | 5.8% | 0.65 |
| Aug 8 17:00:00 - 17:59:59 | 544 | 5.0% | 0.15 | 1.7 MB | 4.2% | 0.47 |
| Aug 8 18:00:00 - 18:59:59 | 485 | 4.5% | 0.13 | 1.8 MB | 4.7% | 0.52 |
| Aug 8 19:00:00 - 19:59:59 | 522 | 4.8% | 0.14 | 1.8 MB | 4.6% | 0.52 |
| Aug 8 20:00:00 - 20:59:59 | 505 | 4.7% | 0.14 | 2.3 MB | 5.8% | 0.64 |
| Aug 8 21:00:00 - 21:59:59 | 438 | 4.1% | 0.12 | 1.6 MB | 4.2% | 0.47 |
| Aug 8 22:00:00 - 22:59:59 | 493 | 4.6% | 0.14 | 2.2 MB | 5.5% | 0.62 |
| Aug 8 23:00:00 - 23:59:59 | 306 | 2.8% | 0.09 | 1.3 MB | 3.3% | 0.36 |
| Aug 9 00:00:00 - 00:59:59 | 265 | 2.5% | 0.07 | 1.3 MB | 3.2% | 0.36 |
| Aug 9 01:00:00 - 01:59:59 | 267 | 2.5% | 0.07 | 1.5 MB | 3.9% | 0.44 |
| Aug 9 02:00:00 - 02:59:59 | 284 | 2.6% | 0.08 | 1.2 MB | 3.2% | 0.36 |
| Aug 9 03:00:00 - 03:59:59 | 198 | 1.8% | 0.06 | 749.7 KB | 1.9% | 0.21 |
| Aug 9 04:00:00 - 04:59:59 | 259 | 2.4% | 0.07 | 1.1 MB | 2.7% | 0.30 |
| Aug 9 05:00:00 - 05:59:59 | 307 | 2.8% | 0.09 | 990.3 KB | 2.5% | 0.28 |
| Aug 9 06:00:00 - 06:59:59 | 438 | 4.1% | 0.12 | 1.5 MB | 3.9% | 0.43 |
| Aug 9 07:00:00 - 07:59:59 | 458 | 4.2% | 0.13 | 1.2 MB | 3.1% | 0.35 |
| Aug 9 08:00:00 - 08:59:59 | 452 | 4.2% | 0.13 | 1.2 MB | 3.0% | 0.34 |
| Aug 9 09:00:00 - 09:59:59 | 449 | 4.2% | 0.12 | 1.4 MB | 3.7% | 0.41 |
| Aug 9 10:00:00 - 10:59:59 | 554 | 5.1% | 0.15 | 1.8 MB | 4.6% | 0.51 |
| Aug 9 11:00:00 - 11:59:59 | 487 | 4.5% | 0.14 | 1.5 MB | 3.7% | 0.42 |
| Aug 9 12:00:00 - 12:59:59 | 590 | 5.5% | 0.16 | 2.5 MB | 6.2% | 0.70 |
| Aug 9 13:00:00 - 13:59:59 | 558 | 5.2% | 0.15 | 2.2 MB | 5.7% | 0.64 |
| Aug 9 14:00:00 - 15:00:02 | 571 | 5.3% | 0.16 | 2.0 MB | 5.1% | 0.57 |
| TOTAL: 24:00:01 | 10781 | 100.0% | 0.12 | 39.4 MB | 100.0% | 0.47 |
CNFS buffer status:
| Buffer | Class | Size | Used | %Used | Cycles | KB/sec | Days |
|---|---|---|---|---|---|---|---|
| EIGHT | BIG | 4.0 GB | 2.9 GB | 72.6% | 1 | 0.00 | 0.00 |
| FIVE | BIG | 4.0 GB | 2.9 GB | 72.6% | 1 | 0.00 | 0.00 |
| FOUR | DEFAULT | 1024.0 MB | 610.6 MB | 59.6% | 22 | 0.17 | 69.74 |
| ONE | DEFAULT | 1024.0 MB | 774.1 MB | 75.6% | 24 | 0.18 | 65.91 |
| SEVEN | BIG | 4.0 GB | 2.9 GB | 72.6% | 1 | 0.00 | 0.00 |
| SIX | BIG | 4.0 GB | 2.9 GB | 72.8% | 1 | 0.00 | 0.00 |
| THREE | DEFAULT | 1024.0 MB | 623.2 MB | 60.9% | 22 | 0.18 | 66.17 |
| TWO | DEFAULT | 1024.0 MB | 608.5 MB | 59.4% | 22 | 0.18 | 67.14 |
| TOTAL: 8 | - | 20.0 GB | 14.2 GB | 70.9% | 94 | 0.18 | - |
Sites sending bad articles:
| Server | Total | Group | Dist | Duplic | Unapp | TooOld | Site | Line | Other | |
|---|---|---|---|---|---|---|---|---|---|---|
| 1 | usenet.blueworldhosting.com | 1210 | 351 | 0 | 0 | 2 | 0 | 0 | 0 | 857 |
| 2 | hasname-out.news.weretis.net | 1099 | 2 | 0 | 0 | 0 | 0 | 0 | 0 | 1097 |
| 3 | news.nntp4.net | 611 | 2 | 0 | 0 | 0 | 0 | 0 | 0 | 609 |
| TOTAL: 3 | 2920 | 355 | 0 | 0 | 2 | 0 | 0 | 0 | 2563 | |
Unwanted newsgroups [Top 20]:
| Newsgroup | Count |
|---|---|
| linux.kernel.git | 85 |
| kraft.vehicles | 68 |
| kraft.competent | 48 |
| odessa.news | 24 |
| kraft.politics | 22 |
| kraft.talks | 21 |
| perl.cpan | 18 |
| linux.kernel.netdev | 9 |
| fido.pushkin.local | 6 |
| rocksolid.feeds.news | 5 |
| kraft.travel | 5 |
| alt.stupid | 5 |
| linux.redhat.rhsa.announce | 5 |
| kraft.marketplace | 4 |
| kraft.blacklog | 4 |
| rocksolid.feeds.tech | 3 |
| kraft.food | 2 |
| kraft-s.test | 2 |
| linux.centos | 2 |
| alt.energy | 2 |
| TOTAL: 33 | 355 |
Supposedly-moderated groups with unmoderated postings [Top 20]:
| Groups | Count |
|---|---|
| uk.religion.christian | 2 |
| TOTAL: 1 | 2 |
INND Perl filter [Top 20]:
| Reason | Count |
|---|---|
| EMP (phn path) | 1048 |
| EMP (md5) | 1045 |
| EMP (phn nph) | 105 |
| Too many newsgroups | 59 |
| EMP (phl) | 40 |
| Binary Image: misplaced jpg | 9 |
| HTML Multipart | 7 |
| Scoring filter | 3 |
| Too many newsgroups (meow) | 2 |
| TOTAL: 9 | 2318 |
INND no permission servers:
| System | Conn |
|---|---|
| 45.227.254.8 | 1 |
| TOTAL: 1 | 1 |
Miscellaneous innd statistics [Top 10]:
| Event | Server | Number |
|---|---|---|
| Bad Message-ID's offered | ||
| usenet.blueworldhosting.com | 2 | |
| TOTAL: 1 | 2 | |
| Including strange strings | ||
| hasname-out.news.weretis.net | 228 | |
| usenet.blueworldhosting.com | 12 | |
| news.nntp4.net | 5 | |
| TOTAL: 3 | 245 | |
| TOTAL: 2 | 247 | |
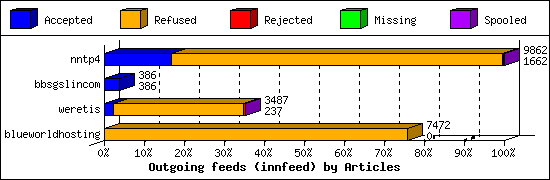
Outgoing Feeds (innfeed) by Articles:
| Server | Offered | Taken | Refused | Reject | Miss | Spool | %Took | Elapsed | |
|---|---|---|---|---|---|---|---|---|---|
| 1 | nntp4 | 10914 | 1662 | 8160 | 39 | 0 | 1 | 15% | 23:59:55 |
| 2 | bbsgslincom | 386 | 386 | 0 | 0 | 0 | 0 | 100% | 20:00:44 |
| 3 | weretis | 5261 | 237 | 3202 | 45 | 0 | 3 | 4% | 23:59:46 |
| 4 | aioe | 0 | 0 | 0 | 0 | 0 | 10726 | 0% | 23:59:56 |
| 5 | blueworldhosting | 8774 | 0 | 7472 | 0 | 0 | 0 | 0% | 23:59:57 |
| TOTAL: 5 | 25335 | 2285 | 18834 | 84 | 0 | 10730 | 9% | 116:00:18 | |
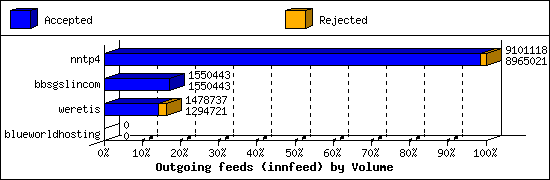
Outgoing Feeds (innfeed) by Volume:
| Server | AcceptVol | RejectVol | TotalVol | Volume/sec | Vol/Art | Elapsed | |
|---|---|---|---|---|---|---|---|
| 1 | nntp4 | 8.5 MB | 132.9 KB | 8.7 MB | 0.1 KB/s | 5.2 KB | 23:59:55 |
| 2 | bbsgslincom | 1.5 MB | 0.0 KB | 1.5 MB | 0.0 KB/s | 3.9 KB | 20:00:44 |
| 3 | weretis | 1.2 MB | 179.7 KB | 1.4 MB | 0.0 KB/s | 5.1 KB | 23:59:46 |
| 4 | aioe | 0.0 KB | 0.0 KB | 0.0 KB | 0.0 KB/s | 0 | 23:59:56 |
| 5 | blueworldhosting | 0.0 KB | 0.0 KB | 0.0 KB | 0.0 KB/s | 0 | 23:59:57 |
| TOTAL: 5 | 11.3 MB | 312.6 KB | 11.6 MB | 0.0 KB/s | 5.0 KB | 116:00:18 | |
NNRP total resource statistics [Top 20]:
| System | User(ms) | System(ms) | Idle(ms) | Elapsed |
|---|---|---|---|---|
| 106.75.18.40 | 0.001 | 0.001 | 0.000 | 00:00:00 |
| magnanimous.monitoring.internet-measurement.com | 0.002 | 0.000 | 0.000 | 00:00:00 |
| 206.125.45.117 | 0.000 | 0.002 | 0.000 | 00:00:00 |
| 192.241.222.76 | 0.002 | 0.000 | 0.000 | 00:00:00 |
| 198.199.93.88 | 0.001 | 0.001 | 0.000 | 00:00:00 |
| 104.152.52.128 | 0.002 | 0.000 | 0.000 | 00:00:00 |
| TOTAL: 6 | 0.008 | 0.004 | 0.000 | 00:00:01 |
NNRP no permission clients:
| System | Conn |
|---|---|
| 192.241.222.76 | 1 |
| magnanimous.monitoring.internet-measurement.com | 1 |
| 104.152.52.128 | 1 |
| 106.75.18.40 | 1 |
| 206.125.45.117 | 1 |
| 198.199.93.88 | 1 |
| TOTAL: 6 | 6 |