Unknown entries from news log file:
First 1 / 1 lines (100.0%)
Log entries by program:
| Program name | Lines | %Lines | Size | %Size |
|---|---|---|---|---|
| inn | 15119 | 63.0% | 2.0 MB | 62.7% |
| innd | 6293 | 26.2% | 862.4 KB | 26.0% |
| innfeed | 1389 | 5.8% | 189.8 KB | 5.7% |
| cnfsstat | 1152 | 4.8% | 178.6 KB | 5.4% |
| nnrpd | 28 | 0.1% | 3.0 KB | 0.1% |
| overchan | 1 | 0.0% | 0.0 KB | 0.0% |
| controlchan | 1 | 0.0% | 0.1 KB | 0.0% |
| TOTAL: 7 | 23983 | 100.0% | 3.2 MB | 100.0% |
History cache:
| Reason | Count | %Count |
|---|---|---|
| Positive hits | 33931 | 41.8% |
| Negative hits | 32449 | 40.0% |
| Do not exist | 14693 | 18.1% |
| Cache misses | 17 | 0.0% |
| TOTAL: 4 | 81090 | 100.0% |
INND timer:
| Code region | Time | Pct | Invoked | Min(ms) | Avg(ms) | Max(ms) |
|---|---|---|---|---|---|---|
| article cancel | 00:00:01.681 | 0.0% | 83 | 0.000 | 20.253 | 794.500 |
| article cleanup | 00:00:00.080 | 0.0% | 14717 | 0.000 | 0.005 | 0.041 |
| article logging | 00:00:00.354 | 0.0% | 14959 | 0.000 | 0.024 | 0.068 |
| article parse | 00:00:00.224 | 0.0% | 26038 | 0.000 | 0.009 | 0.030 |
| article write | 00:00:01.857 | 0.0% | 12170 | 0.000 | 0.153 | 17.227 |
| artlog/artcncl | 00:00:00.002 | 0.0% | 83 | 0.000 | 0.024 | 0.500 |
| artlog/artparse | 00:00:00.000 | 0.0% | 0 | 0.000 | 0.000 | 0.000 |
| data move | 00:00:00.045 | 0.0% | 84017 | 0.000 | 0.001 | 0.007 |
| hisgrep/artcncl | 00:00:00.000 | 0.0% | 54 | 0.000 | 0.000 | 0.000 |
| hishave/artcncl | 00:00:00.000 | 0.0% | 83 | 0.000 | 0.000 | 0.000 |
| history grep | 00:00:00.000 | 0.0% | 0 | 0.000 | 0.000 | 0.000 |
| history lookup | 00:00:01.725 | 0.0% | 81229 | 0.000 | 0.021 | 0.418 |
| history sync | 00:00:00.011 | 0.0% | 346 | 0.000 | 0.032 | 0.500 |
| history write | 00:00:00.628 | 0.0% | 14717 | 0.000 | 0.043 | 1.385 |
| hiswrite/artcncl | 00:00:00.000 | 0.0% | 29 | 0.000 | 0.000 | 0.000 |
| idle | 23:50:22.209 | 100.0% | 87857 | 587.139 | 976.840 | 2587.491 |
| nntp read | 00:00:00.577 | 0.0% | 86949 | 0.000 | 0.007 | 0.017 |
| overview write | 00:00:00.045 | 0.0% | 12170 | 0.000 | 0.004 | 0.025 |
| perl filter | 00:00:14.516 | 0.0% | 14716 | 0.773 | 0.986 | 1.380 |
| python filter | 00:00:00.388 | 0.0% | 14716 | 0.000 | 0.026 | 0.089 |
| site send | 00:00:01.986 | 0.0% | 36510 | 0.024 | 0.054 | 0.113 |
| TOTAL: 23:50:53.672 | 23:50:46.328 | 100.0% | - | - | - | - |
INNfeed timer:
| Code region | Time | Pct | Invoked | Min(ms) | Avg(ms) | Max(ms) |
|---|---|---|---|---|---|---|
| article new | 00:00:00.024 | 0.0% | 12229 | 0.000 | 0.002 | 0.026 |
| article prepare | 00:00:00.000 | 0.0% | 11056 | 0.000 | 0.000 | 0.000 |
| article read | 00:00:00.104 | 0.0% | 2748 | 0.000 | 0.038 | 0.250 |
| backlog stats | 00:00:00.034 | 0.0% | 73753 | 0.000 | 0.000 | 0.005 |
| callbacks | 00:00:00.000 | 0.0% | 0 | 0.000 | 0.000 | 0.000 |
| data read | 00:00:00.313 | 0.0% | 43689 | 0.000 | 0.007 | 0.029 |
| data write | 00:00:00.903 | 0.0% | 31746 | 0.000 | 0.028 | 0.067 |
| idle | 23:57:37.820 | 100.0% | 73753 | 674.290 | 1169.550 | 2684.088 |
| status file | 00:00:00.060 | 0.0% | 250 | 0.000 | 0.240 | 1.000 |
| TOTAL: 23:57:41.190 | 23:57:39.258 | 100.0% | - | - | - | - |
nnrpd timer:
| Code region | Time | Pct | Invoked | Min(ms) | Avg(ms) | Max(ms) |
|---|---|---|---|---|---|---|
| idle | 00:00:00.000 | 0.0% | 0 | 0.000 | 0.000 | 0.000 |
| newnews | 00:00:00.000 | 0.0% | 0 | 0.000 | 0.000 | 0.000 |
| nntpwrite | 00:00:00.000 | 0.0% | 6 | 0.000 | 0.000 | 0.000 |
| TOTAL: 00:00:00.364 | 00:00:00.000 | 0.0% | - | - | - | - |
Control commands to INND:
| Command | Number |
|---|---|
| flush | 5 |
| flushlogs | 2 |
| go | 2 |
| logmode | 2 |
| lowmark | 1 |
| mode | 146 |
| name | 2 |
| pause | 2 |
| paused | 2 |
| reserve | 2 |
| TOTAL: 10 | 166 |
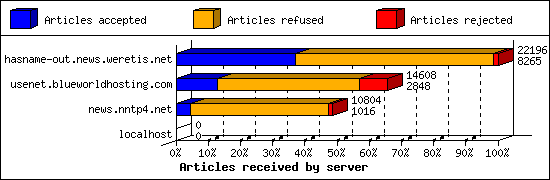
Incoming Feeds (INN):
| Server | Connects | Offered | Taken | Refused | Reject | %Accpt | Elapsed | |
|---|---|---|---|---|---|---|---|---|
| 1 | hasname-out.news.weretis.net | 6 | 22196 | 8265 | 13635 | 296 | 37% | 45:39:37 |
| 2 | usenet.blueworldhosting.com | 720 | 14608 | 2848 | 9798 | 1962 | 19% | 23:48:41 |
| 3 | news.nntp4.net | 1 | 10804 | 1016 | 9486 | 302 | 9% | 23:46:23 |
| 4 | localhost | 1 | 0 | 0 | 0 | 0 | 0% | 00:00:00 |
| TOTAL: 4 | 728 | 47608 | 12129 | 32919 | 2560 | 25% | 93:14:41 | |
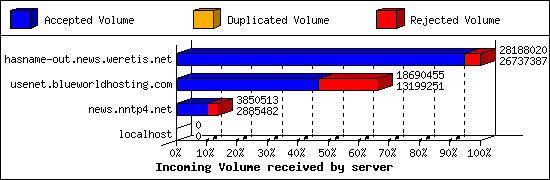
Incoming Volume (INN):
| Server | AcceptVol | DupVol | RejVol | TotalVol | %Acc | Vol/Art | |
|---|---|---|---|---|---|---|---|
| 1 | hasname-out.news.weretis.net | 25.5 MB | 0.0 KB | 1.4 MB | 26.9 MB | 94% | 3.2 KB |
| 2 | usenet.blueworldhosting.com | 12.6 MB | 0.0 KB | 5.2 MB | 17.8 MB | 70% | 3.8 KB |
| 3 | news.nntp4.net | 2.8 MB | 0.0 KB | 942.4 KB | 3.7 MB | 74% | 2.9 KB |
| 4 | localhost | 0.0 KB | 0.0 KB | 0.0 KB | 0.0 KB | 0% | 0 |
| TOTAL: 4 | 40.8 MB | 0.0 KB | 7.5 MB | 48.4 MB | 84% | 3.4 KB | |
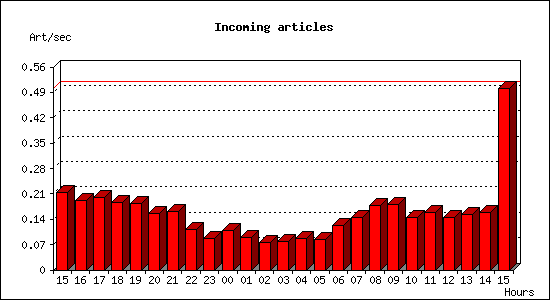
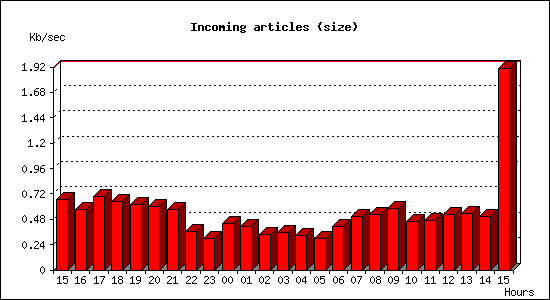
Incoming articles:
| Date | Articles | %Arts | Art/sec | Size | %Size | KB/sec |
|---|---|---|---|---|---|---|
| Jun 12 15:00:02 - 15:59:59 | 769 | 6.3% | 0.21 | 2.3 MB | 5.7% | 0.66 |
| Jun 12 16:00:00 - 16:59:59 | 687 | 5.6% | 0.19 | 2.0 MB | 4.9% | 0.57 |
| Jun 12 17:00:00 - 17:59:59 | 723 | 5.9% | 0.20 | 2.4 MB | 5.9% | 0.69 |
| Jun 12 18:00:00 - 18:59:59 | 668 | 5.5% | 0.19 | 2.3 MB | 5.6% | 0.65 |
| Jun 12 19:00:00 - 19:59:59 | 662 | 5.4% | 0.18 | 2.2 MB | 5.3% | 0.62 |
| Jun 12 20:00:00 - 20:59:59 | 559 | 4.6% | 0.16 | 2.1 MB | 5.1% | 0.60 |
| Jun 12 21:00:00 - 21:59:59 | 576 | 4.7% | 0.16 | 2.0 MB | 4.9% | 0.58 |
| Jun 12 22:00:00 - 22:59:59 | 400 | 3.3% | 0.11 | 1.3 MB | 3.1% | 0.36 |
| Jun 12 23:00:00 - 23:59:59 | 315 | 2.6% | 0.09 | 1.0 MB | 2.5% | 0.29 |
| Jun 13 00:00:00 - 00:59:59 | 396 | 3.2% | 0.11 | 1.5 MB | 3.7% | 0.44 |
| Jun 13 01:00:00 - 01:59:59 | 321 | 2.6% | 0.09 | 1.4 MB | 3.5% | 0.41 |
| Jun 13 02:00:00 - 02:59:59 | 272 | 2.2% | 0.08 | 1.2 MB | 2.9% | 0.34 |
| Jun 13 03:00:00 - 03:59:59 | 285 | 2.3% | 0.08 | 1.2 MB | 3.0% | 0.35 |
| Jun 13 04:00:00 - 04:59:59 | 308 | 2.5% | 0.09 | 1.2 MB | 2.8% | 0.33 |
| Jun 13 05:00:00 - 05:59:59 | 307 | 2.5% | 0.09 | 1.0 MB | 2.5% | 0.30 |
| Jun 13 06:00:00 - 06:59:59 | 440 | 3.6% | 0.12 | 1.5 MB | 3.5% | 0.42 |
| Jun 13 07:00:00 - 07:59:59 | 519 | 4.2% | 0.14 | 1.8 MB | 4.3% | 0.50 |
| Jun 13 08:00:00 - 08:59:59 | 637 | 5.2% | 0.18 | 1.9 MB | 4.5% | 0.53 |
| Jun 13 09:00:00 - 09:59:59 | 649 | 5.3% | 0.18 | 2.0 MB | 4.9% | 0.58 |
| Jun 13 10:00:00 - 10:59:59 | 524 | 4.3% | 0.15 | 1.6 MB | 4.0% | 0.46 |
| Jun 13 11:00:00 - 11:59:59 | 574 | 4.7% | 0.16 | 1.6 MB | 4.0% | 0.46 |
| Jun 13 12:00:00 - 12:59:59 | 523 | 4.3% | 0.15 | 1.9 MB | 4.5% | 0.53 |
| Jun 13 13:00:00 - 13:59:59 | 553 | 4.5% | 0.15 | 1.9 MB | 4.6% | 0.54 |
| Jun 13 14:00:00 - 14:59:59 | 575 | 4.7% | 0.16 | 1.8 MB | 4.3% | 0.51 |
| Jun 13 15:00:00 - 15:00:02 | 1 | 0.0% | 0.50 | 3.8 KB | 0.0% | 1.91 |
| TOTAL: 24:00:00 | 12243 | 100.0% | 0.14 | 41.2 MB | 100.0% | 0.49 |
CNFS buffer status:
| Buffer | Class | Size | Used | %Used | Cycles | KB/sec | Days |
|---|---|---|---|---|---|---|---|
| EIGHT | BIG | 4.0 GB | 2.9 GB | 72.6% | 1 | 0.00 | 0.00 |
| FIVE | BIG | 4.0 GB | 2.9 GB | 72.6% | 1 | 0.00 | 0.00 |
| FOUR | DEFAULT | 1024.0 MB | 735.9 MB | 71.9% | 21 | 0.19 | 62.73 |
| ONE | DEFAULT | 1024.0 MB | 895.7 MB | 87.5% | 23 | 0.19 | 62.27 |
| SEVEN | BIG | 4.0 GB | 2.9 GB | 72.6% | 1 | 0.00 | 0.00 |
| SIX | BIG | 4.0 GB | 2.9 GB | 72.8% | 1 | 0.00 | 0.00 |
| THREE | DEFAULT | 1024.0 MB | 745.1 MB | 72.8% | 21 | 0.19 | 63.01 |
| TWO | DEFAULT | 1024.0 MB | 730.5 MB | 71.3% | 21 | 0.19 | 62.58 |
| TOTAL: 8 | - | 20.0 GB | 14.7 GB | 73.3% | 90 | 0.19 | - |
Sites sending bad articles:
| Server | Total | Group | Dist | Duplic | Unapp | TooOld | Site | Line | Other | |
|---|---|---|---|---|---|---|---|---|---|---|
| 1 | usenet.blueworldhosting.com | 1964 | 480 | 0 | 0 | 0 | 0 | 0 | 0 | 1484 |
| 2 | hasname-out.news.weretis.net | 523 | 13 | 0 | 0 | 0 | 0 | 0 | 0 | 510 |
| 3 | news.nntp4.net | 306 | 12 | 0 | 0 | 0 | 0 | 0 | 0 | 294 |
| TOTAL: 3 | 2793 | 505 | 0 | 0 | 0 | 0 | 0 | 0 | 2288 | |
Unwanted newsgroups [Top 20]:
| Newsgroup | Count |
|---|---|
| kraft.politics | 96 |
| kraft.competent | 76 |
| kraft.vehicles | 47 |
| linux.kernel.git | 42 |
| odessa.news | 35 |
| kraft.talks | 32 |
| fido.pushkin.local | 28 |
| linux.kernel.netdev | 22 |
| perl.cpan | 15 |
| sybase.public.powerdesigner.general | 14 |
| kraft.blacklog | 14 |
| panix.chat.politics | 13 |
| local.general | 13 |
| alfanet.nocem | 12 |
| alt.stupid | 10 |
| rocksolid.feeds.news | 5 |
| newsreader.test | 3 |
| alt.energy | 3 |
| fido.ru.fidonet.today | 3 |
| kraft.whitelog | 2 |
| TOTAL: 38 | 505 |
INND Perl filter [Top 20]:
| Reason | Count |
|---|---|
| EMP (phn path) | 1131 |
| EMP (md5) | 745 |
| EMP (phn nph) | 79 |
| Scoring filter | 42 |
| EMP (phl) | 34 |
| HTML Multipart | 6 |
| Too many newsgroups (meow) | 3 |
| User-issued spam cancel | 2 |
| Binary: misplaced binary | 1 |
| TOTAL: 9 | 2043 |
INND no permission servers:
| System | Conn |
|---|---|
| 94.102.61.27 | 1 |
| TOTAL: 1 | 1 |
Miscellaneous innd statistics [Top 10]:
| Event | Server | Number |
|---|---|---|
| Including strange strings | ||
| hasname-out.news.weretis.net | 226 | |
| news.nntp4.net | 14 | |
| usenet.blueworldhosting.com | 4 | |
| TOTAL: 3 | 244 | |
| TOTAL: 1 | 244 | |
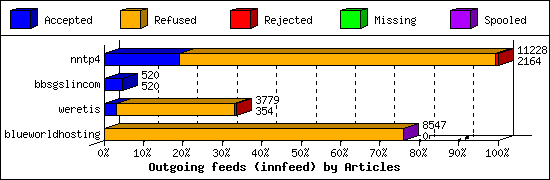
Outgoing Feeds (innfeed) by Articles:
| Server | Offered | Taken | Refused | Reject | Miss | Spool | %Took | Elapsed | |
|---|---|---|---|---|---|---|---|---|---|
| 1 | nntp4 | 12086 | 2164 | 8996 | 68 | 0 | 0 | 17% | 23:59:57 |
| 2 | bbsgslincom | 520 | 520 | 0 | 0 | 0 | 0 | 100% | 19:34:30 |
| 3 | weretis | 5975 | 354 | 3373 | 52 | 0 | 0 | 5% | 23:59:52 |
| 4 | blueworldhosting | 10036 | 0 | 8540 | 0 | 0 | 7 | 0% | 23:59:55 |
| 5 | aioe | 0 | 0 | 0 | 0 | 0 | 12172 | 0% | 23:59:56 |
| TOTAL: 5 | 28617 | 3038 | 20909 | 120 | 0 | 12179 | 10% | 115:34:10 | |
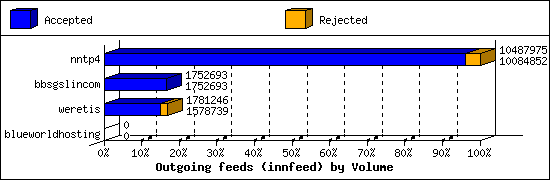
Outgoing Feeds (innfeed) by Volume:
| Server | AcceptVol | RejectVol | TotalVol | Volume/sec | Vol/Art | Elapsed | |
|---|---|---|---|---|---|---|---|
| 1 | nntp4 | 9.6 MB | 393.7 KB | 10.0 MB | 0.1 KB/s | 4.6 KB | 23:59:57 |
| 2 | bbsgslincom | 1.7 MB | 0.0 KB | 1.7 MB | 0.0 KB/s | 3.3 KB | 19:34:30 |
| 3 | weretis | 1.5 MB | 197.8 KB | 1.7 MB | 0.0 KB/s | 4.3 KB | 23:59:52 |
| 4 | blueworldhosting | 0.0 KB | 0.0 KB | 0.0 KB | 0.0 KB/s | 0 | 23:59:55 |
| 5 | aioe | 0.0 KB | 0.0 KB | 0.0 KB | 0.0 KB/s | 0 | 23:59:56 |
| TOTAL: 5 | 12.8 MB | 591.4 KB | 13.4 MB | 0.0 KB/s | 4.3 KB | 115:34:10 | |
NNRP total resource statistics [Top 20]:
| System | User(ms) | System(ms) | Idle(ms) | Elapsed |
|---|---|---|---|---|
| happy.monitoring.internet-measurement.com | 0.001 | 0.001 | 0.000 | 00:00:00 |
| 107.170.247.19 | 0.001 | 0.002 | 0.000 | 00:00:00 |
| scanner-29.ch1.censys-scanner.com | 0.002 | 0.000 | 0.000 | 00:00:00 |
| 162.243.143.23 | 0.002 | 0.001 | 0.000 | 00:00:00 |
| 107.6.112.252 | 0.001 | 0.001 | 0.000 | 00:00:00 |
| 5.39.220.78 | 0.001 | 0.001 | 0.000 | 00:00:00 |
| TOTAL: 6 | 0.008 | 0.006 | 0.000 | 00:00:00 |
NNRP no permission clients:
| System | Conn |
|---|---|
| 162.243.143.23 | 1 |
| happy.monitoring.internet-measurement.com | 1 |
| 107.6.112.252 | 1 |
| 107.170.247.19 | 1 |
| scanner-29.ch1.censys-scanner.com | 1 |
| 5.39.220.78 | 1 |
| TOTAL: 6 | 6 |