Unknown entries from news log file:
First 15 / 15 lines (100.0%)
Log entries by program:
| Program name | Lines | %Lines | Size | %Size |
|---|---|---|---|---|
| inn | 12433 | 65.7% | 1.7 MB | 65.3% |
| innd | 3770 | 19.9% | 539.1 KB | 20.3% |
| innfeed | 1416 | 7.5% | 187.8 KB | 7.1% |
| cnfsstat | 1152 | 6.1% | 175.3 KB | 6.6% |
| nnrpd | 121 | 0.6% | 13.1 KB | 0.5% |
| controlchan | 25 | 0.1% | 3.8 KB | 0.1% |
| pgpverify | 14 | 0.1% | 1.5 KB | 0.1% |
| overchan | 1 | 0.0% | 0.2 KB | 0.0% |
| TOTAL: 8 | 18932 | 100.0% | 2.6 MB | 100.0% |
History cache:
| Reason | Count | %Count |
|---|---|---|
| Positive hits | 27370 | 41.0% |
| Negative hits | 27304 | 40.9% |
| Do not exist | 12071 | 18.1% |
| Cache misses | 29 | 0.0% |
| TOTAL: 4 | 66774 | 100.0% |
INND timer:
| Code region | Time | Pct | Invoked | Min(ms) | Avg(ms) | Max(ms) |
|---|---|---|---|---|---|---|
| article cancel | 00:00:00.440 | 0.0% | 43 | 0.000 | 10.233 | 92.333 |
| article cleanup | 00:00:00.066 | 0.0% | 12136 | 0.000 | 0.005 | 0.043 |
| article logging | 00:00:00.329 | 0.0% | 12404 | 0.000 | 0.027 | 0.083 |
| article parse | 00:00:00.196 | 0.0% | 23041 | 0.000 | 0.009 | 0.034 |
| article write | 00:00:00.506 | 0.0% | 10504 | 0.000 | 0.048 | 0.135 |
| artlog/artcncl | 00:00:00.000 | 0.0% | 42 | 0.000 | 0.000 | 0.000 |
| artlog/artparse | 00:00:00.001 | 0.0% | 2 | 0.500 | 0.500 | 0.500 |
| data move | 00:00:00.031 | 0.0% | 70633 | 0.000 | 0.000 | 0.005 |
| hisgrep/artcncl | 00:00:00.000 | 0.0% | 43 | 0.000 | 0.000 | 0.000 |
| hishave/artcncl | 00:00:00.000 | 0.0% | 43 | 0.000 | 0.000 | 0.000 |
| history grep | 00:00:00.000 | 0.0% | 0 | 0.000 | 0.000 | 0.000 |
| history lookup | 00:00:00.373 | 0.0% | 67130 | 0.000 | 0.006 | 0.129 |
| history sync | 00:00:00.011 | 0.0% | 344 | 0.000 | 0.032 | 0.500 |
| history write | 00:00:00.614 | 0.0% | 12138 | 0.000 | 0.051 | 0.768 |
| hiswrite/artcncl | 00:00:00.000 | 0.0% | 0 | 0.000 | 0.000 | 0.000 |
| idle | 24:00:29.251 | 100.0% | 74848 | 613.665 | 1154.730 | 3594.701 |
| nntp read | 00:00:00.518 | 0.0% | 74307 | 0.000 | 0.007 | 0.020 |
| overview write | 00:00:00.037 | 0.0% | 10504 | 0.000 | 0.004 | 0.042 |
| perl filter | 00:00:12.545 | 0.0% | 12136 | 0.607 | 1.034 | 2.083 |
| python filter | 00:00:00.340 | 0.0% | 12136 | 0.000 | 0.028 | 0.118 |
| site send | 00:00:01.523 | 0.0% | 31526 | 0.000 | 0.048 | 0.096 |
| TOTAL: 24:00:55.076 | 24:00:46.781 | 100.0% | - | - | - | - |
INNfeed timer:
| Code region | Time | Pct | Invoked | Min(ms) | Avg(ms) | Max(ms) |
|---|---|---|---|---|---|---|
| article new | 00:00:00.016 | 0.0% | 10464 | 0.000 | 0.002 | 0.032 |
| article prepare | 00:00:00.003 | 0.0% | 12293 | 0.000 | 0.000 | 0.013 |
| article read | 00:00:00.167 | 0.0% | 3030 | 0.000 | 0.055 | 2.160 |
| backlog stats | 00:00:00.048 | 0.0% | 68849 | 0.000 | 0.001 | 0.005 |
| callbacks | 00:00:00.000 | 0.0% | 0 | 0.000 | 0.000 | 0.000 |
| data read | 00:00:00.282 | 0.0% | 39646 | 0.000 | 0.007 | 0.030 |
| data write | 00:00:00.875 | 0.0% | 29216 | 0.000 | 0.030 | 0.131 |
| idle | 23:58:51.209 | 100.0% | 68849 | 664.227 | 1253.921 | 2930.263 |
| status file | 00:00:00.065 | 0.0% | 274 | 0.000 | 0.237 | 1.000 |
| TOTAL: 23:58:54.507 | 23:58:52.665 | 100.0% | - | - | - | - |
nnrpd timer:
| Code region | Time | Pct | Invoked | Min(ms) | Avg(ms) | Max(ms) |
|---|---|---|---|---|---|---|
| idle | 00:00:00.000 | 0.0% | 0 | 0.000 | 0.000 | 0.000 |
| newnews | 00:00:00.000 | 0.0% | 0 | 0.000 | 0.000 | 0.000 |
| nntpwrite | 00:00:00.000 | 0.0% | 29 | 0.000 | 0.000 | 0.000 |
| TOTAL: 00:00:01.176 | 00:00:00.000 | 0.0% | - | - | - | - |
Control commands to INND:
| Command | Number |
|---|---|
| flush | 5 |
| flushlogs | 2 |
| go | 2 |
| logmode | 2 |
| lowmark | 1 |
| mode | 147 |
| name | 2 |
| pause | 2 |
| paused | 2 |
| reserve | 2 |
| TOTAL: 10 | 167 |
Control Channel:
| Sender | newgroup | rmgroup | Other | Bad PGP | DoIt | OK |
|---|---|---|---|---|---|---|
| control@usenet-fr.news.eu.org | 0 | 0 | 1 | 14 | 0 | 1 |
| TOTAL | 0 | 0 | 1 | 14 | 0 | 1 |
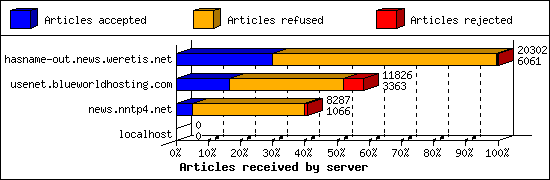
Incoming Feeds (INN):
| Server | Connects | Offered | Taken | Refused | Reject | %Accpt | Elapsed | |
|---|---|---|---|---|---|---|---|---|
| 1 | hasname-out.news.weretis.net | 37 | 20302 | 6061 | 14123 | 118 | 29% | 49:16:45 |
| 2 | usenet.blueworldhosting.com | 288 | 11826 | 3363 | 7172 | 1291 | 28% | 23:46:07 |
| 3 | news.nntp4.net | 2 | 8287 | 1066 | 7036 | 185 | 12% | 23:09:25 |
| 4 | localhost | 1 | 0 | 0 | 0 | 0 | 0% | 00:00:00 |
| TOTAL: 4 | 328 | 40415 | 10490 | 28331 | 1594 | 25% | 96:12:17 | |
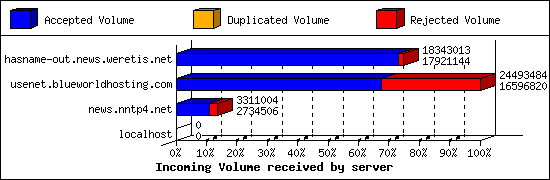
Incoming Volume (INN):
| Server | AcceptVol | DupVol | RejVol | TotalVol | %Acc | Vol/Art | |
|---|---|---|---|---|---|---|---|
| 1 | hasname-out.news.weretis.net | 17.1 MB | 0.0 KB | 412.0 KB | 17.5 MB | 97% | 2.9 KB |
| 2 | usenet.blueworldhosting.com | 15.8 MB | 0.0 KB | 7.5 MB | 23.4 MB | 67% | 5.1 KB |
| 3 | news.nntp4.net | 2.6 MB | 0.0 KB | 563.0 KB | 3.2 MB | 82% | 2.6 KB |
| 4 | localhost | 0.0 KB | 0.0 KB | 0.0 KB | 0.0 KB | 0% | 0 |
| TOTAL: 4 | 35.5 MB | 0.0 KB | 8.5 MB | 44.0 MB | 80% | 3.7 KB | |
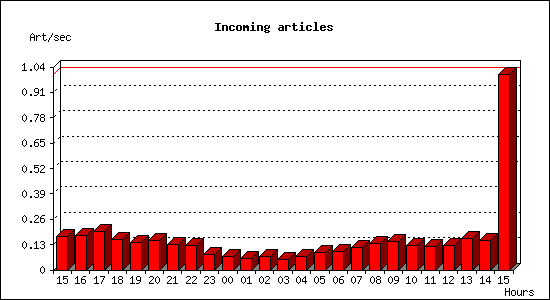
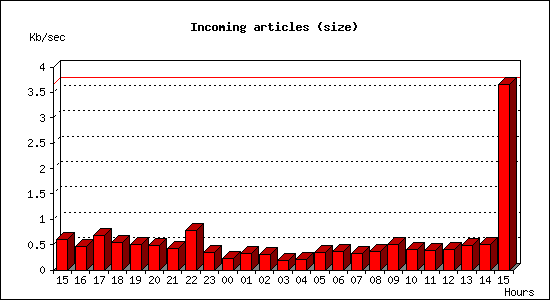
Incoming articles:
| Date | Articles | %Arts | Art/sec | Size | %Size | KB/sec |
|---|---|---|---|---|---|---|
| Jun 9 15:00:01 - 15:59:59 | 621 | 5.9% | 0.17 | 2.1 MB | 6.0% | 0.61 |
| Jun 9 16:00:00 - 16:59:59 | 632 | 6.0% | 0.18 | 1.6 MB | 4.5% | 0.46 |
| Jun 9 17:00:00 - 17:59:59 | 710 | 6.8% | 0.20 | 2.4 MB | 6.7% | 0.68 |
| Jun 9 18:00:00 - 18:59:59 | 560 | 5.3% | 0.16 | 1.9 MB | 5.3% | 0.53 |
| Jun 9 19:00:00 - 19:59:59 | 513 | 4.9% | 0.14 | 1.8 MB | 4.9% | 0.50 |
| Jun 9 20:00:00 - 20:59:59 | 539 | 5.1% | 0.15 | 1.7 MB | 4.7% | 0.48 |
| Jun 9 21:00:00 - 21:59:59 | 466 | 4.5% | 0.13 | 1.5 MB | 4.2% | 0.42 |
| Jun 9 22:00:00 - 22:59:59 | 458 | 4.4% | 0.13 | 2.7 MB | 7.6% | 0.77 |
| Jun 9 23:00:00 - 23:59:59 | 286 | 2.7% | 0.08 | 1.2 MB | 3.3% | 0.34 |
| Jun 10 00:00:00 - 00:59:59 | 256 | 2.4% | 0.07 | 846.0 KB | 2.3% | 0.23 |
| Jun 10 01:00:00 - 01:59:59 | 207 | 2.0% | 0.06 | 1.1 MB | 3.2% | 0.33 |
| Jun 10 02:00:00 - 02:59:59 | 241 | 2.3% | 0.07 | 1.1 MB | 3.1% | 0.31 |
| Jun 10 03:00:00 - 03:59:59 | 192 | 1.8% | 0.05 | 656.4 KB | 1.8% | 0.18 |
| Jun 10 04:00:00 - 04:59:59 | 241 | 2.3% | 0.07 | 725.7 KB | 2.0% | 0.20 |
| Jun 10 05:00:00 - 05:59:59 | 317 | 3.0% | 0.09 | 1.2 MB | 3.5% | 0.35 |
| Jun 10 06:00:00 - 06:59:59 | 346 | 3.3% | 0.10 | 1.3 MB | 3.5% | 0.36 |
| Jun 10 07:00:00 - 07:59:59 | 415 | 4.0% | 0.12 | 1.1 MB | 3.2% | 0.32 |
| Jun 10 08:00:00 - 08:59:59 | 496 | 4.7% | 0.14 | 1.3 MB | 3.7% | 0.37 |
| Jun 10 09:00:00 - 09:59:59 | 521 | 5.0% | 0.14 | 1.8 MB | 5.0% | 0.50 |
| Jun 10 10:00:00 - 10:59:59 | 457 | 4.4% | 0.13 | 1.4 MB | 3.9% | 0.40 |
| Jun 10 11:00:00 - 11:59:59 | 429 | 4.1% | 0.12 | 1.4 MB | 3.8% | 0.39 |
| Jun 10 12:00:00 - 12:59:59 | 451 | 4.3% | 0.13 | 1.4 MB | 3.9% | 0.40 |
| Jun 10 13:00:00 - 13:59:59 | 574 | 5.5% | 0.16 | 1.7 MB | 4.7% | 0.48 |
| Jun 10 14:00:00 - 14:59:59 | 540 | 5.2% | 0.15 | 1.8 MB | 5.0% | 0.51 |
| Jun 10 15:00:00 - 15:00:02 | 2 | 0.0% | 1.00 | 7.3 KB | 0.0% | 3.66 |
| TOTAL: 24:00:01 | 10470 | 100.0% | 0.12 | 35.6 MB | 100.0% | 0.42 |
CNFS buffer status:
| Buffer | Class | Size | Used | %Used | Cycles | KB/sec | Days |
|---|---|---|---|---|---|---|---|
| EIGHT | BIG | 4.0 GB | 2.9 GB | 72.6% | 1 | 0.00 | 0.00 |
| FIVE | BIG | 4.0 GB | 2.9 GB | 72.6% | 1 | 0.00 | 0.00 |
| FOUR | DEFAULT | 1024.0 MB | 689.8 MB | 67.4% | 21 | 0.17 | 70.08 |
| ONE | DEFAULT | 1024.0 MB | 849.1 MB | 82.9% | 23 | 0.17 | 72.58 |
| SEVEN | BIG | 4.0 GB | 2.9 GB | 72.6% | 1 | 0.00 | 0.00 |
| SIX | BIG | 4.0 GB | 2.9 GB | 72.8% | 1 | 0.00 | 0.00 |
| THREE | DEFAULT | 1024.0 MB | 698.6 MB | 68.2% | 21 | 0.17 | 71.66 |
| TWO | DEFAULT | 1024.0 MB | 684.2 MB | 66.8% | 21 | 0.16 | 73.96 |
| TOTAL: 8 | - | 20.0 GB | 14.5 GB | 72.4% | 90 | 0.17 | - |
Sites sending bad articles:
| Server | Total | Group | Dist | Duplic | Unapp | TooOld | Site | Line | Other | |
|---|---|---|---|---|---|---|---|---|---|---|
| 1 | usenet.blueworldhosting.com | 1319 | 485 | 0 | 0 | 1 | 0 | 0 | 0 | 833 |
| 2 | hasname-out.news.weretis.net | 373 | 1 | 0 | 0 | 0 | 0 | 0 | 0 | 372 |
| 3 | news.nntp4.net | 229 | 27 | 0 | 0 | 0 | 0 | 0 | 0 | 202 |
| TOTAL: 3 | 1921 | 513 | 0 | 0 | 1 | 0 | 0 | 0 | 1407 | |
Unwanted newsgroups [Top 20]:
| Newsgroup | Count |
|---|---|
| linux.kernel.netdev | 194 |
| kraft.politics | 111 |
| kraft.competent | 41 |
| local.general | 27 |
| alfanet.nocem | 22 |
| kraft.talks | 22 |
| odessa.news | 22 |
| perl.cpan | 15 |
| linux.kernel.git | 10 |
| alt.stupid | 6 |
| kraft.vehicles | 6 |
| rocksolid.feeds.news | 5 |
| oecher.talk | 3 |
| linux.centos | 2 |
| ka.verkehr | 2 |
| alt.idiot.racist.extreme-one | 2 |
| fido.ipv6 | 2 |
| de.alt.folklore.urban-legends | 1 |
| alt.restaurants.professionals | 1 |
| bln.jugend.talk | 1 |
| TOTAL: 38 | 513 |
Supposedly-moderated groups with unmoderated postings [Top 20]:
| Groups | Count |
|---|---|
| alt.snl | 1 |
| TOTAL: 1 | 1 |
INND Perl filter [Top 20]:
| Reason | Count |
|---|---|
| EMP (md5) | 806 |
| EMP (phn path) | 163 |
| EMP (phn nph) | 118 |
| EMP (phl) | 30 |
| Too many newsgroups | 13 |
| Too many newsgroups (meow) | 5 |
| HTML Multipart | 2 |
| Binary: misplaced binary | 1 |
| Scoring filter | 1 |
| TOTAL: 9 | 1139 |
INND no permission servers:
| System | Conn |
|---|---|
| 167.248.133.38 | 1 |
| TOTAL: 1 | 1 |
Miscellaneous innd statistics [Top 10]:
| Event | Server | Number |
|---|---|---|
| Including strange strings | ||
| hasname-out.news.weretis.net | 254 | |
| news.nntp4.net | 8 | |
| usenet.blueworldhosting.com | 4 | |
| TOTAL: 3 | 266 | |
| No colon-space in header | ||
| usenet.blueworldhosting.com | 2 | |
| TOTAL: 1 | 2 | |
| TOTAL: 2 | 268 | |
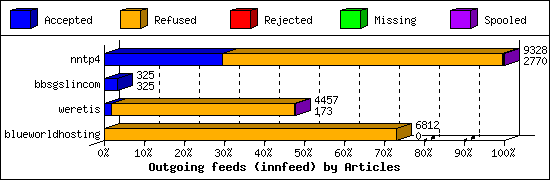
Outgoing Feeds (innfeed) by Articles:
| Server | Offered | Taken | Refused | Reject | Miss | Spool | %Took | Elapsed | |
|---|---|---|---|---|---|---|---|---|---|
| 1 | nntp4 | 9812 | 2770 | 6528 | 29 | 0 | 1 | 28% | 23:59:58 |
| 2 | bbsgslincom | 325 | 325 | 0 | 0 | 0 | 0 | 100% | 15:05:44 |
| 3 | weretis | 7473 | 173 | 4260 | 23 | 0 | 1 | 2% | 23:59:58 |
| 4 | aioe | 0 | 0 | 0 | 0 | 0 | 10423 | 0% | 23:59:58 |
| 5 | blueworldhosting | 8170 | 0 | 6812 | 0 | 0 | 0 | 0% | 23:59:48 |
| TOTAL: 5 | 25780 | 3268 | 17600 | 52 | 0 | 10425 | 12% | 111:05:26 | |
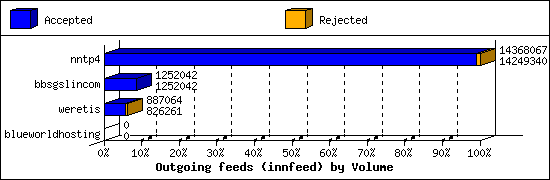
Outgoing Feeds (innfeed) by Volume:
| Server | AcceptVol | RejectVol | TotalVol | Volume/sec | Vol/Art | Elapsed | |
|---|---|---|---|---|---|---|---|
| 1 | nntp4 | 13.6 MB | 115.9 KB | 13.7 MB | 0.2 KB/s | 5.0 KB | 23:59:58 |
| 2 | bbsgslincom | 1.2 MB | 0.0 KB | 1.2 MB | 0.0 KB/s | 3.8 KB | 15:05:44 |
| 3 | weretis | 806.9 KB | 59.4 KB | 866.3 KB | 0.0 KB/s | 4.4 KB | 23:59:58 |
| 4 | aioe | 0.0 KB | 0.0 KB | 0.0 KB | 0.0 KB/s | 0 | 23:59:58 |
| 5 | blueworldhosting | 0.0 KB | 0.0 KB | 0.0 KB | 0.0 KB/s | 0 | 23:59:48 |
| TOTAL: 5 | 15.6 MB | 175.3 KB | 15.7 MB | 0.0 KB/s | 4.9 KB | 111:05:26 | |
NNRP total resource statistics [Top 20]:
| System | User(ms) | System(ms) | Idle(ms) | Elapsed |
|---|---|---|---|---|
| 139-144-52-241.ip.linodeusercontent.com | 0.018 | 0.038 | 0.000 | 00:00:00 |
| 138.199.42.136 | 0.001 | 0.001 | 0.000 | 00:00:00 |
| 192.241.195.99 | 0.001 | 0.002 | 0.000 | 00:00:00 |
| 107.170.208.5 | 0.001 | 0.002 | 0.000 | 00:00:00 |
| merciful.monitoring.internet-measurement.com | 0.000 | 0.003 | 0.000 | 00:00:00 |
| 104.152.52.96 | 0.001 | 0.002 | 0.000 | 00:00:00 |
| 104.152.52.231 | 0.001 | 0.002 | 0.000 | 00:00:00 |
| TOTAL: 7 | 0.023 | 0.050 | 0.000 | 00:00:01 |
NNRP no permission clients:
| System | Conn |
|---|---|
| 139-144-52-241.ip.linodeusercontent.com | 23 |
| 107.170.208.5 | 1 |
| 192.241.195.99 | 1 |
| 138.199.42.136 | 1 |
| merciful.monitoring.internet-measurement.com | 1 |
| 104.152.52.231 | 1 |
| 104.152.52.96 | 1 |
| TOTAL: 7 | 29 |