Log entries by program:
| Program name | Lines | %Lines | Size | %Size |
|---|---|---|---|---|
| inn | 726702 | 98.3% | 88.1 MB | 97.9% |
| innd | 10083 | 1.4% | 1.5 MB | 1.7% |
| innfeed | 1480 | 0.2% | 202.2 KB | 0.2% |
| cnfsstat | 1152 | 0.2% | 183.4 KB | 0.2% |
| nnrpd | 70 | 0.0% | 7.3 KB | 0.0% |
| overchan | 1 | 0.0% | 0.2 KB | 0.0% |
| controlchan | 1 | 0.0% | 0.1 KB | 0.0% |
| TOTAL: 7 | 739489 | 100.0% | 90.0 MB | 100.0% |
History cache:
| Reason | Count | %Count |
|---|---|---|
| Do not exist | 718384 | 66.7% |
| Negative hits | 298453 | 27.7% |
| Positive hits | 60120 | 5.6% |
| Cache misses | 745 | 0.1% |
| TOTAL: 4 | 1077702 | 100.0% |
INND timer:
| Code region | Time | Pct | Invoked | Min(ms) | Avg(ms) | Max(ms) |
|---|---|---|---|---|---|---|
| article cancel | 00:00:00.505 | 0.0% | 52 | 0.000 | 9.712 | 424.000 |
| article cleanup | 00:00:02.708 | 0.0% | 724697 | 0.002 | 0.004 | 0.011 |
| article logging | 00:00:13.642 | 0.0% | 725071 | 0.012 | 0.019 | 0.060 |
| article parse | 00:00:13.929 | 0.0% | 4195827 | 0.002 | 0.003 | 0.005 |
| article write | 00:00:53.839 | 0.1% | 647140 | 0.031 | 0.083 | 0.932 |
| artlog/artcncl | 00:00:00.001 | 0.0% | 51 | 0.000 | 0.020 | 0.500 |
| artlog/artparse | 00:00:00.004 | 0.0% | 234 | 0.000 | 0.017 | 1.000 |
| data move | 00:00:01.773 | 0.0% | 4565429 | 0.000 | 0.000 | 0.001 |
| hisgrep/artcncl | 00:00:00.000 | 0.0% | 30 | 0.000 | 0.000 | 0.000 |
| hishave/artcncl | 00:00:00.014 | 0.0% | 52 | 0.000 | 0.269 | 12.000 |
| history grep | 00:00:00.000 | 0.0% | 0 | 0.000 | 0.000 | 0.000 |
| history lookup | 00:03:15.087 | 0.2% | 1080016 | 0.002 | 0.181 | 3.910 |
| history sync | 00:00:00.012 | 0.0% | 315 | 0.000 | 0.038 | 0.500 |
| history write | 00:00:29.846 | 0.0% | 719368 | 0.014 | 0.041 | 0.500 |
| hiswrite/artcncl | 00:00:00.001 | 0.0% | 22 | 0.000 | 0.045 | 0.200 |
| idle | 23:43:33.242 | 98.8% | 4118981 | 8.566 | 20.736 | 40.927 |
| nntp read | 00:00:33.122 | 0.0% | 4120242 | 0.006 | 0.008 | 0.011 |
| overview write | 00:00:01.304 | 0.0% | 647140 | 0.000 | 0.002 | 0.008 |
| perl filter | 00:08:38.197 | 0.6% | 719134 | 0.432 | 0.721 | 2.042 |
| python filter | 00:00:12.138 | 0.0% | 719134 | 0.011 | 0.017 | 0.037 |
| site send | 00:00:51.769 | 0.1% | 1769919 | 0.023 | 0.029 | 0.043 |
| TOTAL: 24:00:30.668 | 23:59:01.133 | 99.9% | - | - | - | - |
INNfeed timer:
| Code region | Time | Pct | Invoked | Min(ms) | Avg(ms) | Max(ms) |
|---|---|---|---|---|---|---|
| article new | 00:00:00.781 | 0.0% | 934648 | 0.000 | 0.001 | 0.028 |
| article prepare | 00:00:00.101 | 0.0% | 1037214 | 0.000 | 0.000 | 0.001 |
| article read | 00:00:07.796 | 0.0% | 228615 | 0.000 | 0.034 | 0.500 |
| backlog stats | 00:00:00.531 | 0.0% | 2380982 | 0.000 | 0.000 | 0.007 |
| callbacks | 00:00:00.000 | 0.0% | 0 | 0.000 | 0.000 | 0.000 |
| data read | 00:00:09.912 | 0.0% | 1578986 | 0.000 | 0.006 | 0.022 |
| data write | 00:00:17.272 | 0.0% | 1262126 | 0.000 | 0.014 | 0.126 |
| idle | 23:52:55.797 | 99.9% | 2380982 | 15.279 | 36.109 | 4067.660 |
| status file | 00:00:00.082 | 0.0% | 304 | 0.000 | 0.270 | 1.000 |
| TOTAL: 23:53:58.252 | 23:53:32.272 | 100.0% | - | - | - | - |
nnrpd timer:
| Code region | Time | Pct | Invoked | Min(ms) | Avg(ms) | Max(ms) |
|---|---|---|---|---|---|---|
| idle | 00:00:00.000 | 0.0% | 0 | 0.000 | 0.000 | 0.000 |
| newnews | 00:00:00.000 | 0.0% | 0 | 0.000 | 0.000 | 0.000 |
| nntpwrite | 00:00:00.000 | 0.0% | 14 | 0.000 | 0.000 | 0.000 |
| TOTAL: 00:00:01.905 | 00:00:00.000 | 0.0% | - | - | - | - |
Control commands to INND:
| Command | Number |
|---|---|
| flush | 1 |
| go | 2 |
| logmode | 1 |
| lowmark | 1 |
| mode | 149 |
| name | 1 |
| pause | 1 |
| paused | 1 |
| reserve | 2 |
| TOTAL: 9 | 159 |
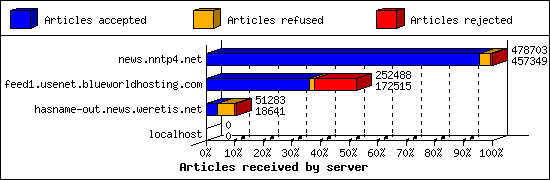
Incoming Feeds (INN):
| Server | Connects | Offered | Taken | Refused | Reject | %Accpt | Elapsed | |
|---|---|---|---|---|---|---|---|---|
| 1 | news.nntp4.net | 45 | 478703 | 457349 | 18851 | 2503 | 95% | 37:27:29 |
| 2 | feed1.usenet.blueworldhosting.com | 720 | 252488 | 172515 | 8806 | 71167 | 68% | 23:46:37 |
| 3 | hasname-out.news.weretis.net | 8 | 51283 | 18641 | 28417 | 4225 | 36% | 49:08:38 |
| 4 | localhost | 1 | 0 | 0 | 0 | 0 | 0% | 00:00:00 |
| TOTAL: 4 | 774 | 782474 | 648505 | 56074 | 77895 | 82% | 110:22:44 | |
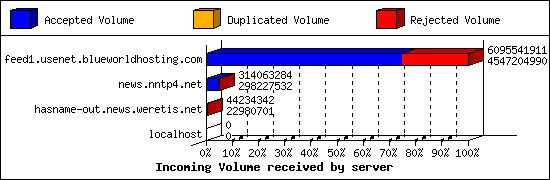
Incoming Volume (INN):
| Server | AcceptVol | DupVol | RejVol | TotalVol | %Acc | Vol/Art | |
|---|---|---|---|---|---|---|---|
| 1 | feed1.usenet.blueworldhosting.com | 4.2 GB | 114.4 KB | 1.4 GB | 5.7 GB | 74% | 24.4 KB |
| 2 | news.nntp4.net | 284.4 MB | 6.0 MB | 9.1 MB | 299.5 MB | 94% | 0.7 KB |
| 3 | hasname-out.news.weretis.net | 21.9 MB | 9.8 MB | 10.5 MB | 42.2 MB | 51% | 1.9 KB |
| 4 | localhost | 0.0 KB | 0.0 KB | 0.0 KB | 0.0 KB | 0% | 0 |
| TOTAL: 4 | 4.5 GB | 15.9 MB | 1.5 GB | 6.0 GB | 75% | 8.7 KB | |
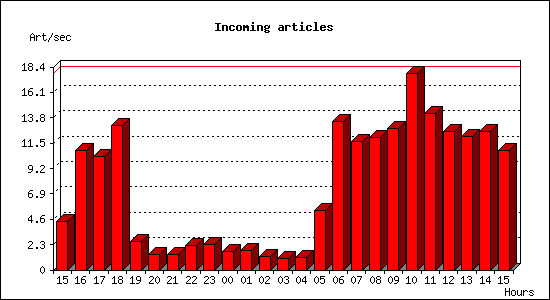
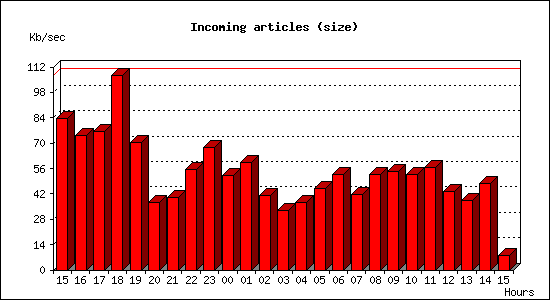
Incoming articles:
| Date | Articles | %Arts | Art/sec | Size | %Size | KB/sec |
|---|---|---|---|---|---|---|
| Apr 15 15:00:01 - 15:59:59 | 15928 | 2.5% | 4.43 | 294.2 MB | 6.3% | 83.70 |
| Apr 15 16:00:00 - 16:59:59 | 38948 | 6.0% | 10.82 | 260.7 MB | 5.6% | 74.17 |
| Apr 15 17:00:00 - 17:59:59 | 37034 | 5.7% | 10.29 | 267.8 MB | 5.8% | 76.17 |
| Apr 15 18:00:00 - 18:59:59 | 47261 | 7.3% | 13.13 | 378.0 MB | 8.1% | 107.53 |
| Apr 15 19:00:00 - 19:59:59 | 9387 | 1.4% | 2.61 | 247.8 MB | 5.3% | 70.49 |
| Apr 15 20:00:00 - 20:59:59 | 4977 | 0.8% | 1.38 | 130.9 MB | 2.8% | 37.23 |
| Apr 15 21:00:00 - 21:59:59 | 5049 | 0.8% | 1.40 | 140.9 MB | 3.0% | 40.07 |
| Apr 15 22:00:00 - 22:59:59 | 7860 | 1.2% | 2.18 | 194.8 MB | 4.2% | 55.42 |
| Apr 15 23:00:00 - 23:59:59 | 8382 | 1.3% | 2.33 | 237.7 MB | 5.1% | 67.62 |
| Apr 16 00:00:00 - 00:59:59 | 6114 | 0.9% | 1.70 | 182.4 MB | 3.9% | 51.88 |
| Apr 16 01:00:00 - 01:59:59 | 6380 | 1.0% | 1.77 | 207.6 MB | 4.5% | 59.06 |
| Apr 16 02:00:00 - 02:59:59 | 4523 | 0.7% | 1.26 | 144.0 MB | 3.1% | 40.95 |
| Apr 16 03:00:00 - 03:59:59 | 3692 | 0.6% | 1.03 | 116.3 MB | 2.5% | 33.09 |
| Apr 16 04:00:00 - 04:59:59 | 4146 | 0.6% | 1.15 | 131.1 MB | 2.8% | 37.29 |
| Apr 16 05:00:00 - 05:59:59 | 19454 | 3.0% | 5.40 | 158.0 MB | 3.4% | 44.95 |
| Apr 16 06:00:00 - 06:59:59 | 48372 | 7.5% | 13.44 | 185.4 MB | 4.0% | 52.74 |
| Apr 16 07:00:00 - 07:59:59 | 42012 | 6.5% | 11.67 | 147.4 MB | 3.2% | 41.91 |
| Apr 16 08:00:00 - 08:59:59 | 43224 | 6.7% | 12.01 | 185.2 MB | 4.0% | 52.68 |
| Apr 16 09:00:00 - 09:59:59 | 46132 | 7.1% | 12.81 | 190.9 MB | 4.1% | 54.31 |
| Apr 16 10:00:00 - 10:59:59 | 64152 | 9.9% | 17.82 | 185.6 MB | 4.0% | 52.79 |
| Apr 16 11:00:00 - 11:59:59 | 51213 | 7.9% | 14.23 | 198.5 MB | 4.3% | 56.47 |
| Apr 16 12:00:00 - 12:59:59 | 45264 | 7.0% | 12.57 | 152.8 MB | 3.3% | 43.45 |
| Apr 16 13:00:00 - 13:59:59 | 43712 | 6.7% | 12.14 | 134.9 MB | 2.9% | 38.38 |
| Apr 16 14:00:00 - 14:59:59 | 45153 | 7.0% | 12.54 | 167.6 MB | 3.6% | 47.66 |
| Apr 16 15:00:00 - 15:00:05 | 54 | 0.0% | 10.80 | 38.8 KB | 0.0% | 7.77 |
| TOTAL: 24:00:04 | 648423 | 100.0% | 7.50 | 4.5 GB | 100.0% | 55.00 |
CNFS buffer status:
| Buffer | Class | Size | Used | %Used | Cycles | KB/sec | Days |
|---|---|---|---|---|---|---|---|
| EIGHT | BIG | 4.0 GB | 669.5 MB | 16.3% | 1 | 13.91 | 3.49 |
| FIVE | BIG | 4.0 GB | 664.3 MB | 16.2% | 1 | 13.87 | 3.50 |
| FOUR | DEFAULT | 1024.0 MB | 98.3 MB | 9.6% | 20 | 5.55 | 2.19 |
| ONE | DEFAULT | 1024.0 MB | 260.6 MB | 25.4% | 22 | 5.55 | 2.19 |
| SEVEN | BIG | 4.0 GB | 671.2 MB | 16.4% | 1 | 13.96 | 3.48 |
| SIX | BIG | 4.0 GB | 673.9 MB | 16.5% | 1 | 13.88 | 3.50 |
| THREE | DEFAULT | 1024.0 MB | 106.4 MB | 10.4% | 20 | 5.55 | 2.19 |
| TWO | DEFAULT | 1024.0 MB | 91.7 MB | 9.0% | 20 | 5.55 | 2.19 |
| TOTAL: 8 | - | 20.0 GB | 3.2 GB | 15.8% | 86 | 9.73 | - |
Sites sending bad articles:
| Server | Total | Group | Dist | Duplic | Unapp | TooOld | Site | Line | Other | |
|---|---|---|---|---|---|---|---|---|---|---|
| 1 | feed1.usenet.blueworldhosting.com | 71185 | 69651 | 0 | 31 | 0 | 0 | 0 | 0 | 1503 |
| 2 | hasname-out.news.weretis.net | 4403 | 2 | 0 | 3905 | 0 | 0 | 0 | 0 | 496 |
| 3 | news.nntp4.net | 2640 | 1 | 0 | 1651 | 0 | 0 | 0 | 0 | 988 |
| TOTAL: 3 | 78228 | 69654 | 0 | 5587 | 0 | 0 | 0 | 0 | 2987 | |
Unwanted newsgroups [Top 20]:
| Newsgroup | Count |
|---|---|
| alt.binaries.encrypted | 5354 |
| alt.binaries.wtfnzb.bravo | 2511 |
| alt.binaries.wtfnzb.alpha | 2496 |
| alt.binaries.wtfnzb.lima | 2410 |
| alt.binaries.wtfnzb.beta | 2388 |
| alt.binaries.wtfnzb.foxtrot | 2383 |
| alt.binaries.wtfnzb.juliet | 2376 |
| alt.binaries.wtfnzb.golf | 2374 |
| alt.binaries.wtfnzb.charlie | 2367 |
| alt.binaries.wtfnzb.novemeber | 2364 |
| alt.binaries.wtfnzb.hotel | 2361 |
| alt.binaries.wtfnzb.kilo | 2354 |
| alt.binaries.wtfnzb.delta | 2348 |
| alt.binaries.wtfnzb.echo | 2347 |
| alt.binaries.wtfnzb.mike | 2328 |
| alt.binaries.wtfnzb.india | 2316 |
| alt.binaries.ath | 1951 |
| alt.binaries.newznzb.charlie | 1746 |
| alt.binaries.newznzb.delta | 1691 |
| alt.binaries.font | 1443 |
| TOTAL: 169 | 69654 |
INND Perl filter [Top 20]:
| Reason | Count |
|---|---|
| EMP (md5) | 789 |
| EMP (phn path) | 641 |
| Scoring filter | 250 |
| Binary: misplaced binary | 196 |
| EMP (fsl) | 154 |
| Too many newsgroups (low_xpost) | 136 |
| EMP (phl) | 126 |
| EMP (phn nph) | 34 |
| Adult group ECP | 18 |
| Too many newsgroups | 12 |
| MID-Bot | 5 |
| Angle-bracket bot | 5 |
| Too many newsgroups (meow) | 5 |
| HTML Multipart | 2 |
| Poison newsgroup | 1 |
| Excessively crossposted test article | 1 |
| TOTAL: 16 | 2375 |
INND no permission servers:
| System | Conn |
|---|---|
| 94.102.61.27 | 1 |
| TOTAL: 1 | 1 |
Miscellaneous innd statistics [Top 10]:
| Event | Server | Number |
|---|---|---|
| Including strange strings | ||
| news.nntp4.net | 203 | |
| hasname-out.news.weretis.net | 163 | |
| feed1.usenet.blueworldhosting.com | 8 | |
| TOTAL: 3 | 374 | |
| No colon-space in header | ||
| feed1.usenet.blueworldhosting.com | 235 | |
| TOTAL: 1 | 235 | |
| TOTAL: 2 | 609 | |
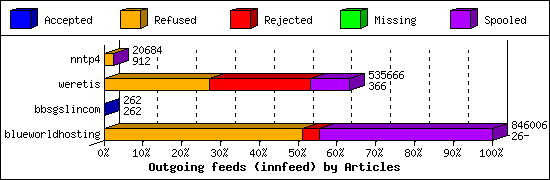
Outgoing Feeds (innfeed) by Articles:
| Server | Offered | Taken | Refused | Reject | Miss | Spool | %Took | Elapsed | |
|---|---|---|---|---|---|---|---|---|---|
| 1 | nntp4 | 20657 | 912 | 19088 | 23 | 0 | 661 | 4% | 23:53:47 |
| 2 | weretis | 562963 | 366 | 229506 | 221452 | 0 | 84342 | 0% | 24:04:11 |
| 3 | bbsgslincom | 262 | 262 | 0 | 0 | 0 | 0 | 100% | 16:48:45 |
| 4 | blueworldhosting | 857029 | 26 | 433828 | 36454 | 0 | 375698 | 0% | 23:52:21 |
| 5 | aioe | 0 | 0 | 0 | 0 | 0 | 470980 | 0% | 23:50:00 |
| TOTAL: 5 | 1440911 | 1566 | 682422 | 257929 | 0 | 931681 | 0% | 112:29:04 | |
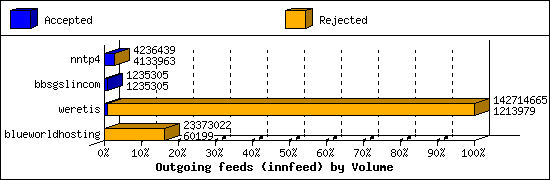
Outgoing Feeds (innfeed) by Volume:
| Server | AcceptVol | RejectVol | TotalVol | Volume/sec | Vol/Art | Elapsed | |
|---|---|---|---|---|---|---|---|
| 1 | nntp4 | 3.9 MB | 100.1 KB | 4.0 MB | 0.0 KB/s | 4.4 KB | 23:53:47 |
| 2 | bbsgslincom | 1.2 MB | 0.0 KB | 1.2 MB | 0.0 KB/s | 4.6 KB | 16:48:45 |
| 3 | weretis | 1.2 MB | 134.9 MB | 136.1 MB | 1.6 KB/s | 0.6 KB | 24:04:11 |
| 4 | blueworldhosting | 58.8 KB | 22.2 MB | 22.3 MB | 0.3 KB/s | 0.6 KB | 23:52:21 |
| 5 | aioe | 0.0 KB | 0.0 KB | 0.0 KB | 0.0 KB/s | 0 | 23:50:00 |
| TOTAL: 5 | 6.3 MB | 157.3 MB | 163.6 MB | 0.4 KB/s | 0.6 KB | 112:29:04 | |
NNRP total resource statistics [Top 20]:
| System | User(ms) | System(ms) | Idle(ms) | Elapsed |
|---|---|---|---|---|
| 94.232.45.247 | 0.001 | 0.002 | 0.000 | 00:00:01 |
| 137.184.13.100 | 0.001 | 0.003 | 0.000 | 00:00:00 |
| 159.89.124.112 | 0.002 | 0.003 | 0.000 | 00:00:00 |
| 64.226.86.7 | 0.002 | 0.004 | 0.000 | 00:00:00 |
| 147.182.247.10 | 0.001 | 0.004 | 0.000 | 00:00:00 |
| 107.170.228.26 | 0.001 | 0.002 | 0.000 | 00:00:00 |
| 64.225.74.178 | 0.002 | 0.002 | 0.000 | 00:00:00 |
| 80.66.77.238 | 0.000 | 0.002 | 0.000 | 00:00:00 |
| 104.152.52.205 | 0.002 | 0.000 | 0.000 | 00:00:00 |
| TOTAL: 9 | 0.012 | 0.022 | 0.000 | 00:00:01 |
NNRP no permission clients:
| System | Conn |
|---|---|
| 64.225.74.178 | 2 |
| 159.89.124.112 | 2 |
| 64.226.86.7 | 2 |
| 147.182.247.10 | 2 |
| 137.184.13.100 | 2 |
| 107.170.228.26 | 1 |
| 80.66.77.238 | 1 |
| 94.232.45.247 | 1 |
| 104.152.52.205 | 1 |
| TOTAL: 9 | 14 |