Unknown entries from news log file:
First 1 / 1 lines (100.0%)
Log entries by program:
| Program name | Lines | %Lines | Size | %Size |
|---|---|---|---|---|
| inn | 229553 | 96.0% | 29.3 MB | 95.6% |
| innd | 6876 | 2.9% | 1019.0 KB | 3.3% |
| innfeed | 1432 | 0.6% | 192.2 KB | 0.6% |
| cnfsstat | 1152 | 0.5% | 173.2 KB | 0.6% |
| nnrpd | 60 | 0.0% | 6.3 KB | 0.0% |
| overchan | 1 | 0.0% | 0.2 KB | 0.0% |
| controlchan | 1 | 0.0% | 0.1 KB | 0.0% |
| TOTAL: 7 | 239075 | 100.0% | 30.6 MB | 100.0% |
History cache:
| Reason | Count | %Count |
|---|---|---|
| Negative hits | 231403 | 45.1% |
| Do not exist | 227610 | 44.4% |
| Positive hits | 53685 | 10.5% |
| Cache misses | 270 | 0.1% |
| TOTAL: 4 | 512968 | 100.0% |
INND timer:
| Code region | Time | Pct | Invoked | Min(ms) | Avg(ms) | Max(ms) |
|---|---|---|---|---|---|---|
| article cancel | 00:00:00.004 | 0.0% | 46 | 0.000 | 0.087 | 4.000 |
| article cleanup | 00:00:01.191 | 0.0% | 228206 | 0.000 | 0.005 | 0.024 |
| article logging | 00:00:05.236 | 0.0% | 228559 | 0.000 | 0.023 | 0.092 |
| article parse | 00:00:09.571 | 0.0% | 2934286 | 0.000 | 0.003 | 0.032 |
| article write | 00:00:13.075 | 0.0% | 172228 | 0.000 | 0.076 | 0.408 |
| artlog/artcncl | 00:00:00.000 | 0.0% | 34 | 0.000 | 0.000 | 0.000 |
| artlog/artparse | 00:00:00.001 | 0.0% | 197 | 0.000 | 0.005 | 0.333 |
| data move | 00:00:01.765 | 0.0% | 3498243 | 0.000 | 0.001 | 0.004 |
| hisgrep/artcncl | 00:00:00.001 | 0.0% | 36 | 0.000 | 0.028 | 1.000 |
| hishave/artcncl | 00:00:00.002 | 0.0% | 46 | 0.000 | 0.043 | 2.000 |
| history grep | 00:00:00.000 | 0.0% | 0 | 0.000 | 0.000 | 0.000 |
| history lookup | 00:00:17.892 | 0.0% | 513259 | 0.000 | 0.035 | 0.178 |
| history sync | 00:00:00.373 | 0.0% | 346 | 0.000 | 1.078 | 181.500 |
| history write | 00:00:10.540 | 0.0% | 227619 | 0.000 | 0.046 | 0.541 |
| hiswrite/artcncl | 00:00:00.000 | 0.0% | 10 | 0.000 | 0.000 | 0.000 |
| idle | 23:52:55.957 | 99.5% | 3080293 | 11.165 | 27.912 | 1367.248 |
| nntp read | 00:00:26.519 | 0.0% | 3079654 | 0.001 | 0.009 | 0.011 |
| overview write | 00:00:00.465 | 0.0% | 172228 | 0.000 | 0.003 | 0.024 |
| perl filter | 00:05:20.294 | 0.4% | 227422 | 0.308 | 1.408 | 1.873 |
| python filter | 00:00:04.636 | 0.0% | 227422 | 0.000 | 0.020 | 0.155 |
| site send | 00:00:12.325 | 0.0% | 380152 | 0.024 | 0.032 | 0.081 |
| TOTAL: 24:00:43.948 | 23:59:59.847 | 99.9% | - | - | - | - |
INNfeed timer:
| Code region | Time | Pct | Invoked | Min(ms) | Avg(ms) | Max(ms) |
|---|---|---|---|---|---|---|
| article new | 00:00:00.065 | 0.0% | 48703 | 0.000 | 0.001 | 0.022 |
| article prepare | 00:00:00.008 | 0.0% | 68754 | 0.000 | 0.000 | 0.000 |
| article read | 00:00:00.456 | 0.0% | 15004 | 0.000 | 0.030 | 0.429 |
| backlog stats | 00:00:00.064 | 0.0% | 170604 | 0.000 | 0.000 | 0.008 |
| callbacks | 00:00:00.000 | 0.0% | 0 | 0.000 | 0.000 | 0.000 |
| data read | 00:00:00.641 | 0.0% | 105422 | 0.000 | 0.006 | 0.032 |
| data write | 00:00:01.390 | 0.0% | 88904 | 0.000 | 0.016 | 0.073 |
| idle | 23:58:59.408 | 100.0% | 170604 | 23.983 | 506.081 | 3231.538 |
| status file | 00:00:00.395 | 0.0% | 266 | 0.000 | 1.485 | 26.000 |
| TOTAL: 23:59:11.917 | 23:59:02.427 | 100.0% | - | - | - | - |
nnrpd timer:
| Code region | Time | Pct | Invoked | Min(ms) | Avg(ms) | Max(ms) |
|---|---|---|---|---|---|---|
| idle | 00:00:00.000 | 0.0% | 0 | 0.000 | 0.000 | 0.000 |
| newnews | 00:00:00.000 | 0.0% | 0 | 0.000 | 0.000 | 0.000 |
| nntpwrite | 00:00:00.001 | 0.1% | 12 | 0.000 | 0.083 | 1.000 |
| TOTAL: 00:00:00.921 | 00:00:00.001 | 0.1% | - | - | - | - |
Control commands to INND:
| Command | Number |
|---|---|
| flush | 5 |
| flushlogs | 2 |
| go | 2 |
| logmode | 2 |
| lowmark | 1 |
| mode | 147 |
| name | 2 |
| pause | 2 |
| paused | 2 |
| reserve | 2 |
| TOTAL: 10 | 167 |
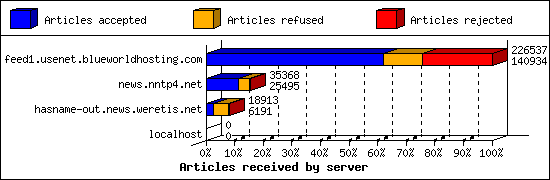
Incoming Feeds (INN):
| Server | Connects | Offered | Taken | Refused | Reject | %Accpt | Elapsed | |
|---|---|---|---|---|---|---|---|---|
| 1 | feed1.usenet.blueworldhosting.com | 681 | 226537 | 140934 | 30766 | 54837 | 62% | 23:44:25 |
| 2 | news.nntp4.net | 9 | 35368 | 25495 | 9041 | 832 | 72% | 26:35:37 |
| 3 | hasname-out.news.weretis.net | 4 | 18913 | 6191 | 11974 | 748 | 32% | 45:03:04 |
| 4 | localhost | 1 | 0 | 0 | 0 | 0 | 0% | 00:00:00 |
| TOTAL: 4 | 695 | 280818 | 172620 | 51781 | 56417 | 61% | 95:23:06 | |
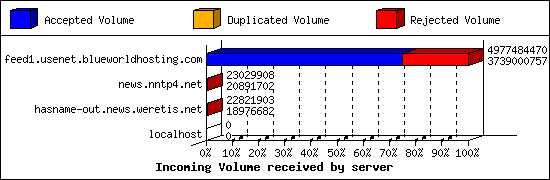
Incoming Volume (INN):
| Server | AcceptVol | DupVol | RejVol | TotalVol | %Acc | Vol/Art | |
|---|---|---|---|---|---|---|---|
| 1 | feed1.usenet.blueworldhosting.com | 3.5 GB | 31.1 KB | 1.2 GB | 4.6 GB | 75% | 24.8 KB |
| 2 | news.nntp4.net | 19.9 MB | 471.4 KB | 1.6 MB | 22.0 MB | 90% | 0.9 KB |
| 3 | hasname-out.news.weretis.net | 18.1 MB | 1.3 MB | 2.3 MB | 21.8 MB | 83% | 3.2 KB |
| 4 | localhost | 0.0 KB | 0.0 KB | 0.0 KB | 0.0 KB | 0% | 0 |
| TOTAL: 4 | 3.5 GB | 1.8 MB | 1.2 GB | 4.7 GB | 75% | 21.4 KB | |
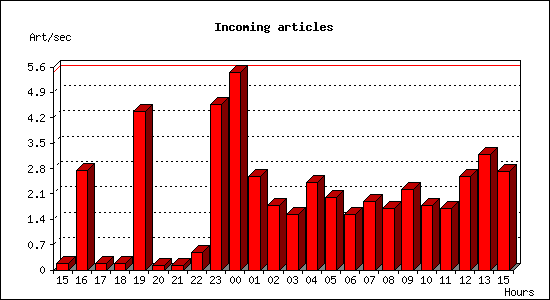
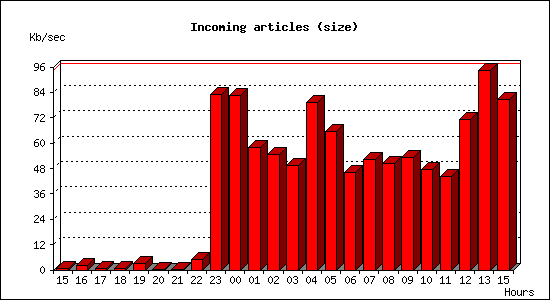
Incoming articles:
| Date | Articles | %Arts | Art/sec | Size | %Size | KB/sec |
|---|---|---|---|---|---|---|
| Apr 13 15:00:01 - 15:59:59 | 648 | 0.4% | 0.18 | 1.9 MB | 0.1% | 0.55 |
| Apr 13 16:00:00 - 16:59:59 | 9833 | 5.7% | 2.73 | 7.6 MB | 0.2% | 2.16 |
| Apr 13 17:00:00 - 17:59:59 | 626 | 0.4% | 0.17 | 1.8 MB | 0.1% | 0.51 |
| Apr 13 18:00:00 - 18:59:59 | 650 | 0.4% | 0.18 | 1.8 MB | 0.1% | 0.53 |
| Apr 13 19:00:00 - 19:59:59 | 15725 | 9.1% | 4.37 | 11.0 MB | 0.3% | 3.14 |
| Apr 13 20:00:00 - 20:59:59 | 477 | 0.3% | 0.13 | 1.5 MB | 0.0% | 0.43 |
| Apr 13 21:00:00 - 21:59:59 | 447 | 0.3% | 0.12 | 1.6 MB | 0.0% | 0.45 |
| Apr 13 22:00:00 - 22:59:59 | 1728 | 1.0% | 0.48 | 18.2 MB | 0.5% | 5.18 |
| Apr 13 23:00:00 - 23:59:59 | 16461 | 9.5% | 4.57 | 291.0 MB | 8.1% | 82.76 |
| Apr 14 00:00:00 - 00:59:59 | 19654 | 11.4% | 5.46 | 290.9 MB | 8.1% | 82.75 |
| Apr 14 01:00:00 - 01:59:59 | 9255 | 5.4% | 2.57 | 203.7 MB | 5.7% | 57.94 |
| Apr 14 02:00:00 - 02:59:59 | 6368 | 3.7% | 1.77 | 191.7 MB | 5.3% | 54.52 |
| Apr 14 03:00:00 - 03:59:59 | 5525 | 3.2% | 1.53 | 174.3 MB | 4.8% | 49.58 |
| Apr 14 04:00:00 - 04:59:59 | 8682 | 5.0% | 2.41 | 278.9 MB | 7.7% | 79.34 |
| Apr 14 05:00:00 - 05:59:59 | 7192 | 4.2% | 2.00 | 231.0 MB | 6.4% | 65.72 |
| Apr 14 06:00:00 - 06:59:59 | 5551 | 3.2% | 1.54 | 162.5 MB | 4.5% | 46.22 |
| Apr 14 07:00:00 - 07:59:59 | 6780 | 3.9% | 1.88 | 183.0 MB | 5.1% | 52.06 |
| Apr 14 08:00:00 - 08:59:59 | 6121 | 3.5% | 1.70 | 177.5 MB | 4.9% | 50.49 |
| Apr 14 09:00:00 - 09:59:59 | 8011 | 4.6% | 2.23 | 187.7 MB | 5.2% | 53.39 |
| Apr 14 10:00:00 - 10:59:59 | 6429 | 3.7% | 1.79 | 166.3 MB | 4.6% | 47.31 |
| Apr 14 11:00:00 - 11:59:59 | 6088 | 3.5% | 1.69 | 155.4 MB | 4.3% | 44.21 |
| Apr 14 12:00:00 - 12:59:59 | 9250 | 5.4% | 2.57 | 250.4 MB | 6.9% | 71.23 |
| Apr 14 13:00:00 - 13:59:59 | 11500 | 6.7% | 3.19 | 331.0 MB | 9.2% | 94.15 |
| Apr 14 14:00:00 - 15:00:01 | 9754 | 5.6% | 2.71 | 283.3 MB | 7.9% | 80.56 |
| TOTAL: 24:00:00 | 172755 | 100.0% | 2.00 | 3.5 GB | 100.0% | 42.72 |
CNFS buffer status:
| Buffer | Class | Size | Used | %Used | Cycles | KB/sec | Days |
|---|---|---|---|---|---|---|---|
| EIGHT | BIG | 4.0 GB | 1.8 GB | 45.2% | 0 | 16.89 | 2.87 |
| FIVE | BIG | 4.0 GB | 1.8 GB | 45.2% | 0 | 16.87 | 2.88 |
| FOUR | DEFAULT | 1024.0 MB | 589.6 MB | 57.6% | 19 | 0.46 | 26.32 |
| ONE | DEFAULT | 1024.0 MB | 751.4 MB | 73.4% | 21 | 0.46 | 26.43 |
| SEVEN | BIG | 4.0 GB | 1.8 GB | 45.2% | 0 | 16.97 | 2.86 |
| SIX | BIG | 4.0 GB | 1.8 GB | 45.5% | 0 | 17.05 | 2.85 |
| THREE | DEFAULT | 1024.0 MB | 598.1 MB | 58.4% | 19 | 0.46 | 26.39 |
| TWO | DEFAULT | 1024.0 MB | 583.0 MB | 56.9% | 19 | 0.46 | 26.52 |
| TOTAL: 8 | - | 20.0 GB | 9.7 GB | 48.5% | 78 | 7.08 | - |
Sites sending bad articles:
| Server | Total | Group | Dist | Duplic | Unapp | TooOld | Site | Line | Other | |
|---|---|---|---|---|---|---|---|---|---|---|
| 1 | feed1.usenet.blueworldhosting.com | 54866 | 53651 | 0 | 42 | 1 | 0 | 0 | 0 | 1172 |
| 2 | hasname-out.news.weretis.net | 1021 | 0 | 0 | 310 | 0 | 0 | 0 | 0 | 711 |
| 3 | news.nntp4.net | 877 | 0 | 0 | 432 | 0 | 0 | 0 | 0 | 445 |
| TOTAL: 3 | 56764 | 53651 | 0 | 784 | 1 | 0 | 0 | 0 | 2328 | |
Unwanted newsgroups [Top 20]:
| Newsgroup | Count |
|---|---|
| alt.binaries.encrypted | 4046 |
| alt.binaries.wtfnzb.delta | 2014 |
| alt.binaries.wtfnzb.beta | 1990 |
| alt.binaries.wtfnzb.lima | 1980 |
| alt.binaries.wtfnzb.foxtrot | 1979 |
| alt.binaries.wtfnzb.golf | 1976 |
| alt.binaries.wtfnzb.charlie | 1951 |
| alt.binaries.wtfnzb.echo | 1945 |
| alt.binaries.wtfnzb.kilo | 1944 |
| alt.binaries.wtfnzb.alpha | 1942 |
| alt.binaries.wtfnzb.bravo | 1941 |
| alt.binaries.wtfnzb.hotel | 1929 |
| alt.binaries.wtfnzb.juliet | 1925 |
| alt.binaries.wtfnzb.novemeber | 1917 |
| alt.binaries.wtfnzb.mike | 1894 |
| alt.binaries.wtfnzb.india | 1871 |
| alt.binaries.ath | 1539 |
| alt.binaries.ninja | 1179 |
| alt.binaries.amazing | 1036 |
| alt.binaries.font | 1014 |
| TOTAL: 143 | 53651 |
Supposedly-moderated groups with unmoderated postings [Top 20]:
| Groups | Count |
|---|---|
| bit.listserv.catholic | 1 |
| TOTAL: 1 | 1 |
INND Perl filter [Top 20]:
| Reason | Count |
|---|---|
| EMP (phn path) | 654 |
| EMP (md5) | 567 |
| Binary: misplaced binary | 169 |
| Scoring filter | 104 |
| EMP (phl) | 95 |
| Too many newsgroups | 82 |
| EMP (phn nph) | 31 |
| EMP (fsl) | 25 |
| Too many newsgroups (low_xpost) | 15 |
| Adult group ECP | 13 |
| Excessively crossposted test article | 4 |
| HTML Multipart | 4 |
| Angle-bracket bot | 4 |
| Too many newsgroups (meow) | 2 |
| MID-Bot | 1 |
| TOTAL: 15 | 1770 |
Miscellaneous innd statistics [Top 10]:
| Event | Server | Number |
|---|---|---|
| Including strange strings | ||
| hasname-out.news.weretis.net | 269 | |
| news.nntp4.net | 55 | |
| feed1.usenet.blueworldhosting.com | 29 | |
| TOTAL: 3 | 353 | |
| No colon-space in header | ||
| feed1.usenet.blueworldhosting.com | 198 | |
| TOTAL: 1 | 198 | |
| TOTAL: 2 | 551 | |
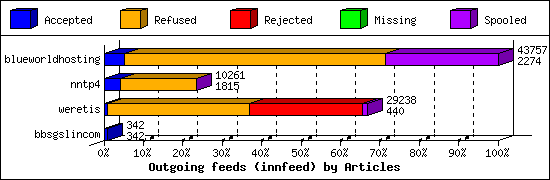
Outgoing Feeds (innfeed) by Articles:
| Server | Offered | Taken | Refused | Reject | Miss | Spool | %Took | Elapsed | |
|---|---|---|---|---|---|---|---|---|---|
| 1 | blueworldhosting | 47419 | 2274 | 28982 | 22 | 0 | 12479 | 4% | 23:59:50 |
| 2 | nntp4 | 11100 | 1815 | 8409 | 35 | 0 | 2 | 16% | 23:59:50 |
| 3 | weretis | 33011 | 440 | 15738 | 12520 | 0 | 540 | 1% | 23:58:57 |
| 4 | bbsgslincom | 342 | 342 | 0 | 0 | 0 | 0 | 100% | 19:00:59 |
| 5 | aioe | 0 | 0 | 0 | 0 | 0 | 35618 | 0% | 23:59:50 |
| TOTAL: 5 | 91872 | 4871 | 53129 | 12577 | 0 | 48639 | 5% | 114:59:26 | |
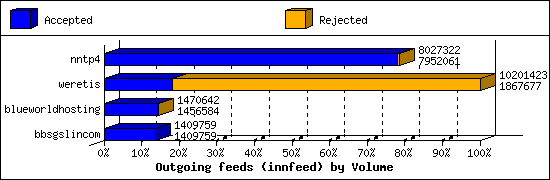
Outgoing Feeds (innfeed) by Volume:
| Server | AcceptVol | RejectVol | TotalVol | Volume/sec | Vol/Art | Elapsed | |
|---|---|---|---|---|---|---|---|
| 1 | nntp4 | 7.6 MB | 73.5 KB | 7.7 MB | 0.1 KB/s | 4.2 KB | 23:59:50 |
| 2 | weretis | 1.8 MB | 7.9 MB | 9.7 MB | 0.1 KB/s | 0.8 KB | 23:58:57 |
| 3 | blueworldhosting | 1.4 MB | 13.7 KB | 1.4 MB | 0.0 KB/s | 0.6 KB | 23:59:50 |
| 4 | bbsgslincom | 1.3 MB | 0.0 KB | 1.3 MB | 0.0 KB/s | 4.0 KB | 19:00:59 |
| 5 | aioe | 0.0 KB | 0.0 KB | 0.0 KB | 0.0 KB/s | 0 | 23:59:50 |
| TOTAL: 5 | 12.1 MB | 8.0 MB | 20.1 MB | 0.0 KB/s | 1.2 KB | 114:59:26 | |
NNRP total resource statistics [Top 20]:
| System | User(ms) | System(ms) | Idle(ms) | Elapsed |
|---|---|---|---|---|
| 165.227.188.42 | 0.004 | 0.007 | 0.000 | 00:00:00 |
| 147.182.241.81 | 0.002 | 0.003 | 0.000 | 00:00:00 |
| 208.100.26.229 | 0.000 | 0.005 | 0.000 | 00:00:00 |
| 165.227.110.45 | 0.001 | 0.004 | 0.000 | 00:00:00 |
| 162.243.147.26 | 0.001 | 0.002 | 0.000 | 00:00:00 |
| 192.241.218.45 | 0.002 | 0.001 | 0.000 | 00:00:00 |
| TOTAL: 6 | 0.010 | 0.022 | 0.000 | 00:00:00 |
NNRP no permission clients:
| System | Conn |
|---|---|
| 165.227.188.42 | 4 |
| 208.100.26.229 | 2 |
| 147.182.241.81 | 2 |
| 165.227.110.45 | 2 |
| 162.243.147.26 | 1 |
| 192.241.218.45 | 1 |
| TOTAL: 6 | 12 |